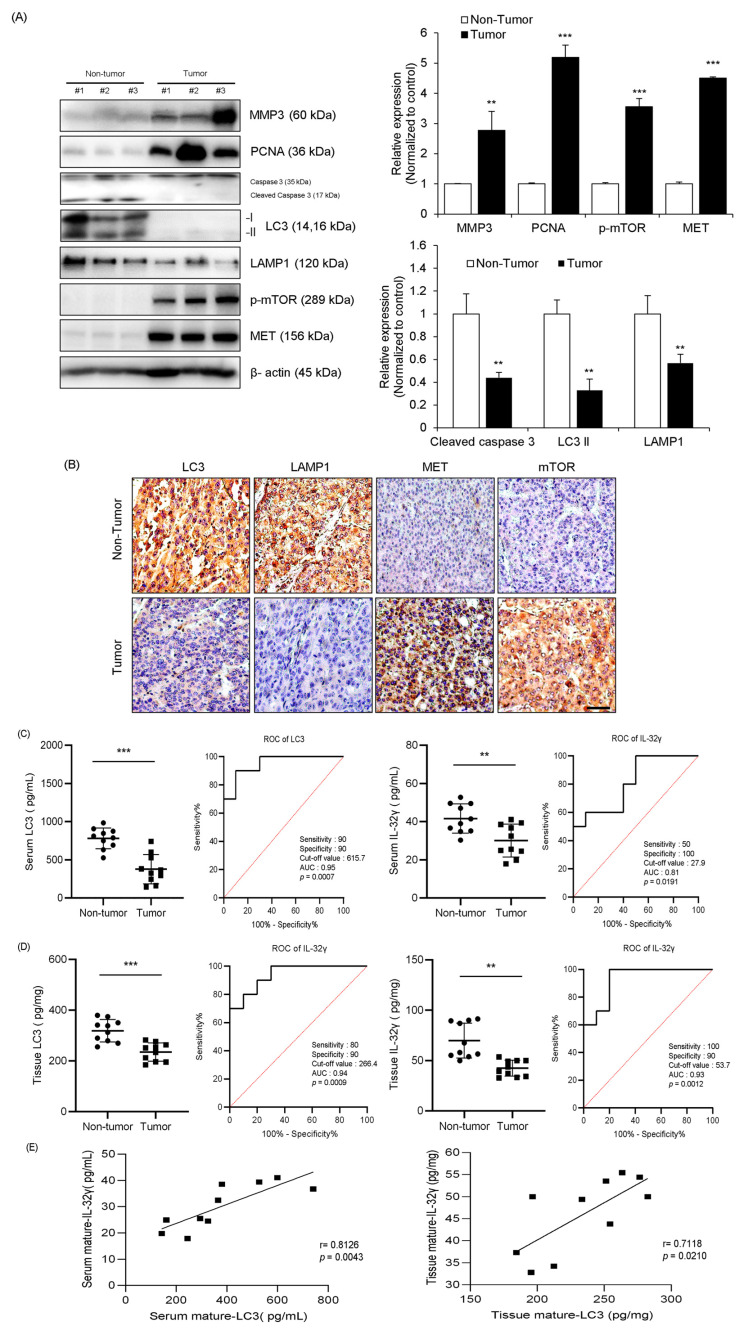
Figure 6.
Autophagy and mTOR pathway play in human liver tumors of patients. (A) Autophagy-related markers (LC3 and LAMP1), MET, and p-mTOR expression in liver cancer patients and normals were analyzed by western blotting, n = 3 per group. The intensity of each band was measured, and the ratio of the amount of each protein to β-actin was calculated. Data are presented as mean ± standard deviation (SD) from three independent experiments. **, p < 0.01, ***, p < 0.001 (one-way ANOVA). (B) Representative images of tumor tissues from each group. Immunohistochemistry staining (LC3, LAMP1, p-mTOR, and MET) was repeated from three independent experiments. Scale bar: 100 μm. (C,D) Serum and tissue levels of LC3 and IL-32 γ in liver cancer patients and their control and receiver operating characteristic (ROC) curve. n = 10 for the control group; n = 10 for the patient group. *** p < 0.0012 (unpaired two-tailed t-test). (E) Spearman correlation test results between IL-32 and LC3.

