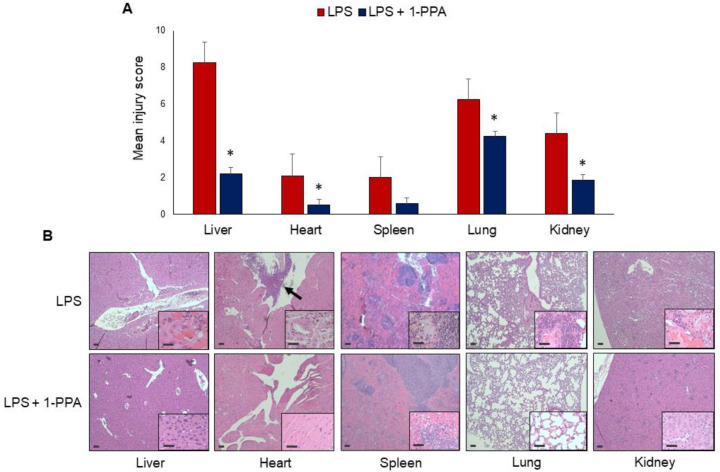
Figure 7.
Histological analysis of the organ injury. (A) injury score of different solid organs after 6 h from LPS administration in untreated mice (n = 12) and in the group of mice treated with 1-PPA 190 μMol (n = 12) * p =< 0.05. The results are expressed as Mean ± SEM (Mann–Whitney test); (B) Representative examples of histological results in the different organs, after hematoxylin-eosin staining in one mouse injected with LPS and in one mouse LPS-injected and treated with 1-PPA. The arrow indicates a large area of leukocyte infiltrate in the aortic valve. Magnification of the panels 5× and inserts 20×. Bar = 10 μm.

