
Fig. 2.
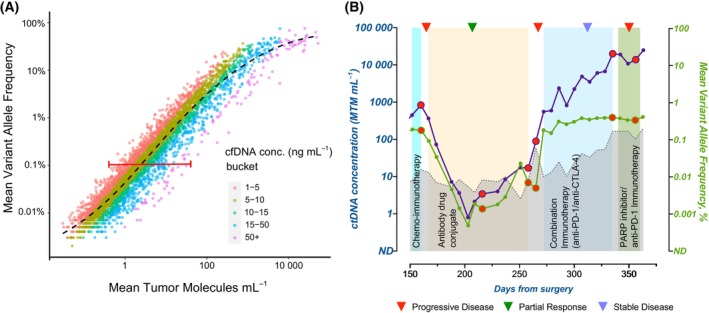
Correlation between MTM/ml and mean VAF (%). (A) Correlation of MTM/ml versus mean VAF (%) across ctDNA‐positive samples. Samples bucketed by total cfDNA concentration (ng·mL−1) are represented. Red line indicates linear correlation between MTM/ml and mean VAF (%) (logmeanVAF = 0.87 logMTM/ml − 7.58; R2 = 0.932). Black line indicates LOESS regression. As represented, when MTM/ml and VAF were compared based on cfDNA, at >50 ng·mL−1 (pink dots), a wide horizontal distribution of MTM/ml is observed for any given mVAF value. (B) Utility of MTM/ml versus mean VAF (%) in informing treatment decisions in a patient with metastatic triple‐negative breast cancer. During treatment response monitoring with ctDNA, serial (longitudinal) time points were processed at regular intervals. ctDNA measured in MTM/ml (purple line) or mean VAF (%) (green line) is represented. Changes in ctDNA dynamics from the previous time point were tracked, and discrepancies in ctDNA dynamics as measured by MTM/ml versus mean VAF (%) were noted (red dots). Imaging results as defined by RECIST criteria are indicated by inverted triangles. Gray line indicates cfDNA measurement. Adapted with permission from Azzi et al. 2022, Case Reports in Oncology, 2022;15:473–479, Published by S. Karger AG, Basel. cfDNA, cell‐free DNA; ctDNA, circulating tumor DNA; MTM, mean tumor molecules; VAF, variant allele frequency.