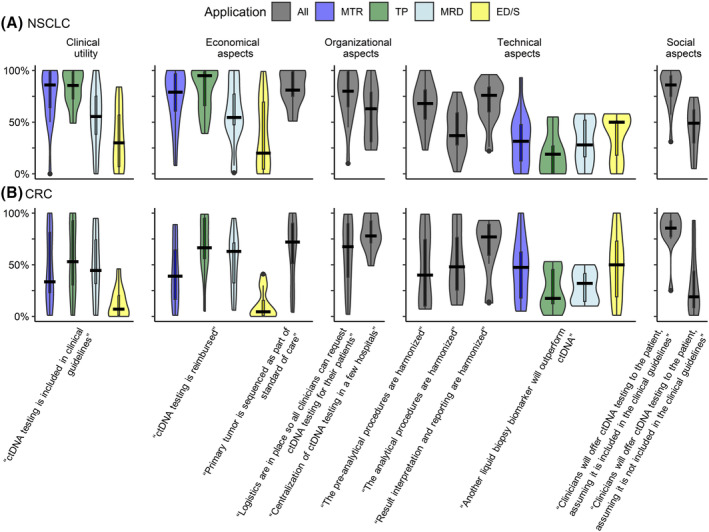
Fig. 4.

Overview results of 5‐year likelihood per scenario. (A, B) 5‐year likelihood of scenarios regarding ctDNA testing implementation per clinical application. (A) Result for NSCLC. (B) Results for CRC. X‐axis shows the scenarios per theme, y‐axis shows the likelihood between 0 and 100%. Black line shows the median in each scenario. All, all applications; ED/S, early detection/screening; MTR, monitoring treatment response; TP, tumor profiling.
