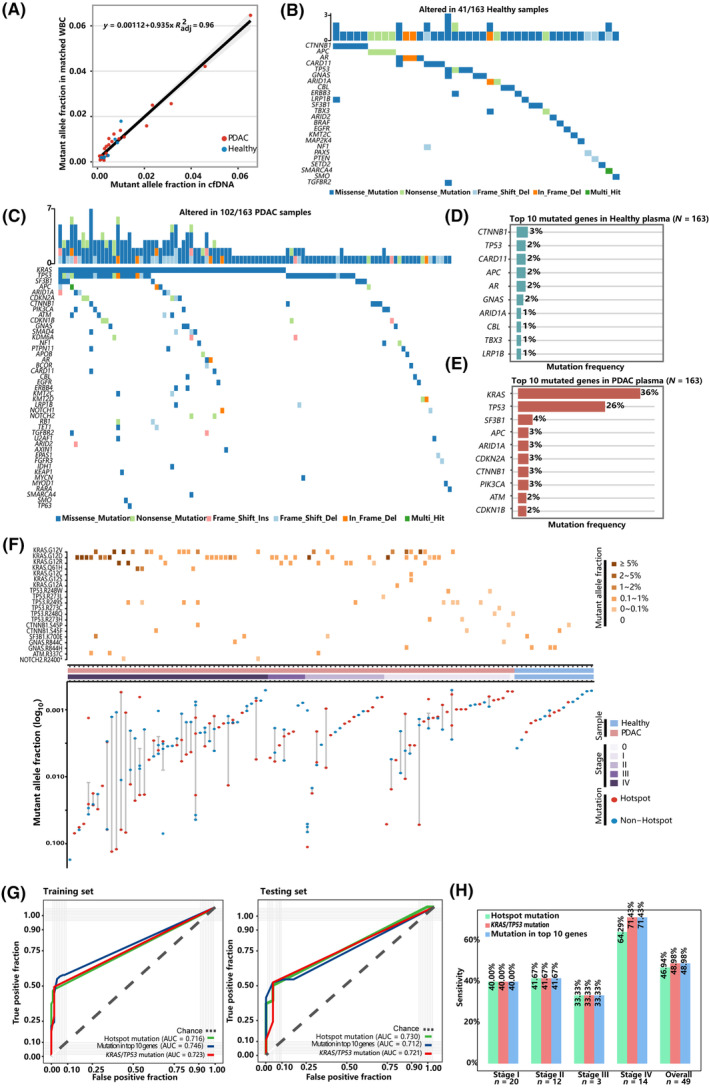
Fig. 2.

Mutation landscape of plasma cfDNA and mutation‐based diagnostic models for PDAC. (A) Correlation of AFs for shared mutations between cfDNA and paired WBC. Mutational landscape of plasma cfDNA in healthy controls (B) and (C) PDAC patients. Each column represents a PDAC or healthy plasma sample. Upper bar chart represents the number of mutations in each sample. Lower waterfall diagram depicts the mutated genes in each sample. Top 10 mutated genes in healthy (D) and PDAC plasma cfDNA (E). (F) The upper heatmap shows the mutant hotspots, and color depicts the level of mutant AFs. The Bottom plot demonstrates AFs of variants detected by hotspot status (G) Performance of the diagnostic models in the training (left) and testing (right) dataset using different indicators of mutational status. (H) PDAC sensitivity in the testing set by stage at the specificity of 95.9%. AF, allele fractions; cfDNA, circulating cell‐free DNA; PDAC, pancreatic ductal adenocarcinoma; WBC, white blood cells.
