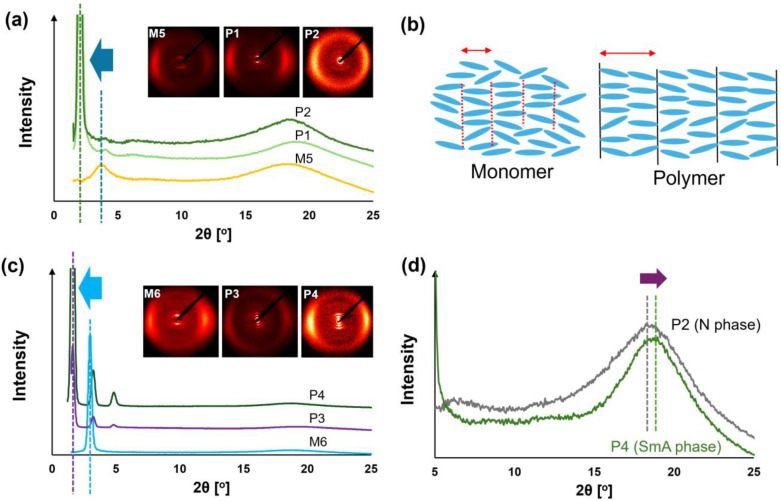
Figure 2.
WAXD intensity profiles and expected structure in LC phase. (a) WAXD intensity profile in nematic (N) phase for M5 (80 °C), P1 (40 °C), and P2 (30 °C). The 2θsmall values are shifted to small angle region due to the polymer effect. (b) Schematic illustration of molecular packing in N phase with cybotactic cluster for monomer (monolayer) and polymer (double-layer). (c) WAXD intensity profile in smectic A phase for M6 (80 °C), P3 (30 °C), and P4 (30 °C) The 2θsmall values are shifted to small angle region due to the polymer effect. (d) WAXD intensity profile for P2 and P4 in wide-angle region recorded at 30 °C. The 2θwide value for SmA phase is slightly larger than that for N phase.

