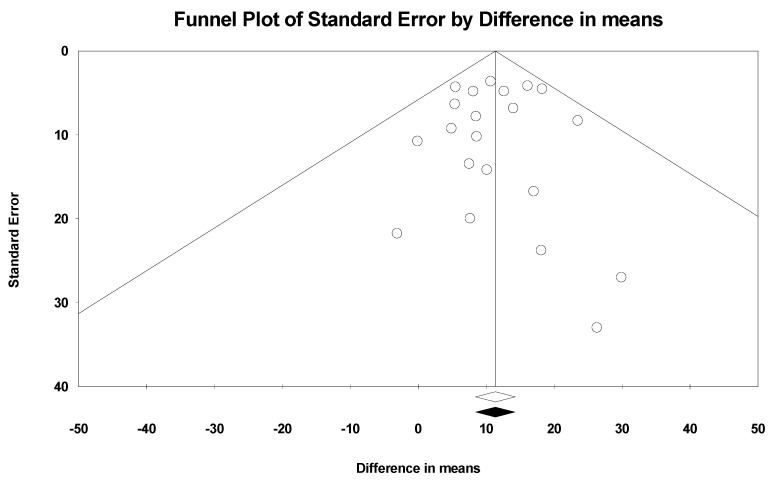
Figure 7.
Observed and imputed funnel plot for lower-body muscle strength. The funnel plot displays the distribution of studies included in this meta-analysis, with white circles representing the original observed studies. At the bottom of the funnel plot, the white and black diamonds represent the combined effect sizes, with the white diamond indicating the overall effect from the observed studies and the black diamond showing the adjusted effect after imputation.

