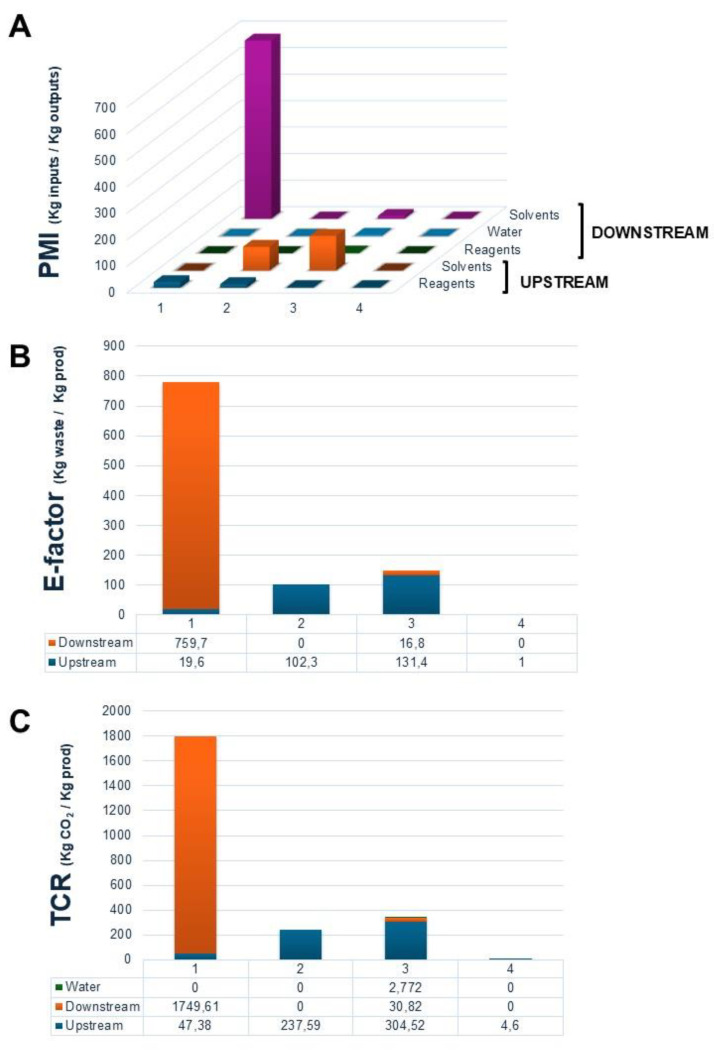
Figure 8.
Analysis of waste and CO2 emissions in the strategies in Table 3. (A) PMI: Representation of the contribution of substrates and reagents, solvents and water to the PMI value in the upstream and downstream processes; (B) E-factor: Relation of mass of waste accumulated with respect to the mass of the HT-monoester product in the upstream and downstream processes; (C) TCR: Mass of CO2 emissions as a result of the incineration of organic and aqueous waste in the upstream and downstream processes. The analyses for entry 2 are only referred to the upstream.

