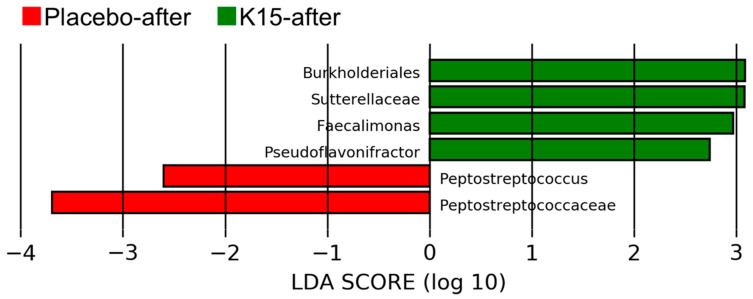
Figure 3.
Linear discriminant analysis (LDA) scores of the fecal microbiota for each group after the study period. The horizontal axis presents the LDA scores for the placebo (red bars) and K15 groups (green bars) for bacterial groups with significant differences in abundance between points before and after the study period.

