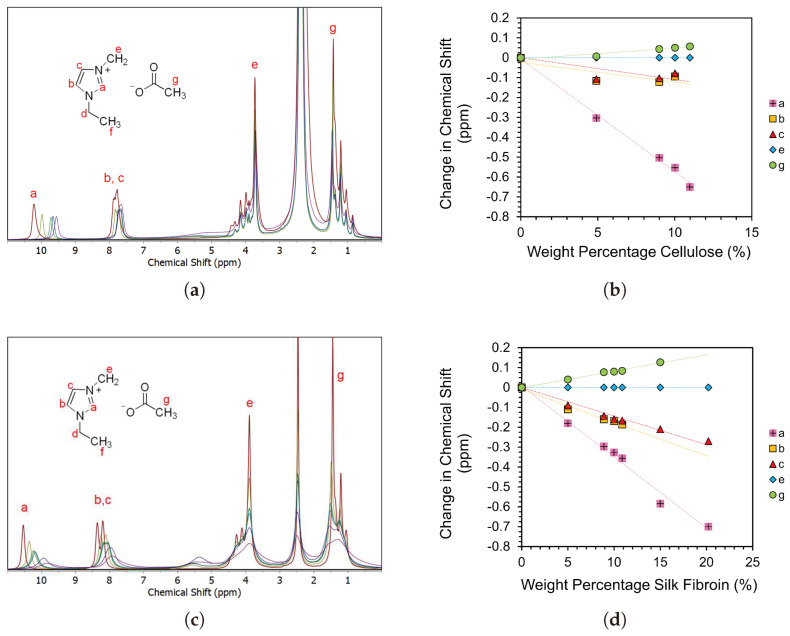
Figure 5.
(a,c) 1H NMR spectra of 2:8 EmimAc:DMSO solutions at various cellulose concentrations and 8:2 EmimAc:DMSO solutions at various SF concentrations, respectively. The inset shows the chemical structure of the [Emim]+ and [Ac]− ions of EmimAc. Peaks signals labeled a–g are attributed to equivalent proton environments seen on the EmimAc diagrams. (b,d) show the concentration dependence of the change in 1H NMR chemical shifts for the proton environments labelled in the inset molecular diagram. Linear fits are included as a guide to the eye. The error bars are approximately equal to the size of the data points used. Samples above 11 wt% MCC are too viscous to be prepared in the given NMR tubes. In SF fibre solutions with undissolved content, the solution is pipetted away from the undissolved content for NMR analysis. All peak integrals and tabulated raw data can be seen in Tables S2 and S3.

