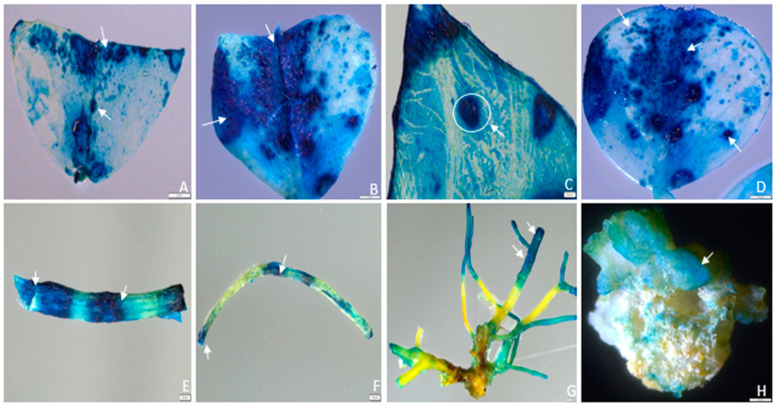
Figure 3.
Histochemical localization of transient GUS gene expression in alfalfa different types of explants: (A) GUS gene expression in segmented leaf explants (0.2 cm), indicated by dark blue spots; (B) prominent GUS gene expression observed in the midrib region of a larger leaf explant (0.4 cm); (C) the circle shows a magnified view (6×) of a single blue spot with GUS expression in multiple cells within the midrib area; (D) dark-to-light blue pattern within single or multiple cells, indicating GUS-positive cells’ distribution across the leaflet; (E) active GUS expression in the axillary bud and nodal regions of the stem, marked by dark spots with enhanced expression; (F) subtle GUS gene expression observed in the petioles; (G) high levels of GUS gene expression observed in the lateral root area; (H) scattered GUS expression observed in 3-week-old leaf-derived callus. Arrows indicate specific regions of GUS gene expression in different explants and leaf-derived callus. Scale bars = 200 pixels.

