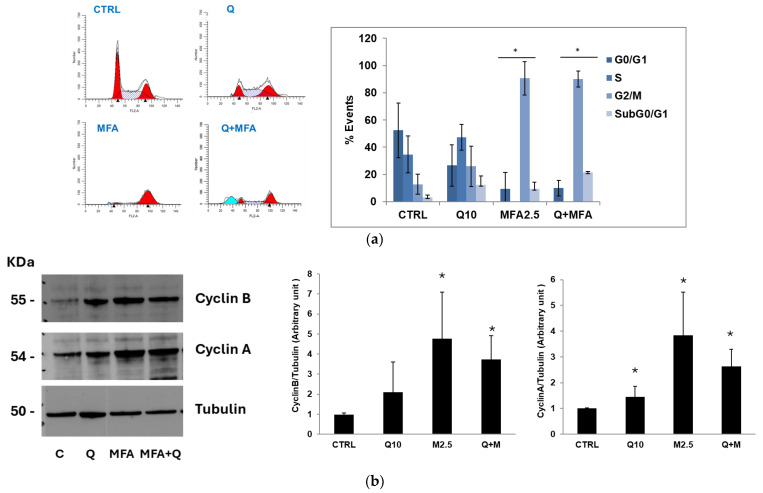
Figure 3.
Quercetin and MFA’s impact on cell cycle in J82 cells. (a) J82 cells were stimulated with quercetin (Q; 10 μM) and mafosfamide (MFA 2.5 μg/mL) alone or in combination for 36 h and cell cycle analysis was performed using Modfit LT software. The average ± s.d. of the data obtained from n = 4 experiments, expressed as the number of cells (% events) present in the various phases of the cell cycle, is reported in the bar graph. Symbols indicate significance: p < 0.05 (*) compared to CTRL. (b) Immunoblotting analysis of cyclin B and cyclin A expression in treated J82 cells. Blots are representative of one out of n = 3 experiments for cyclin B and n = 2 experiments for cyclin A, performed separately. Densitometric analysis is reported in the bar graph on the left and is expressed as the ratio between cyclins and α-tubulin band intensities means ± s.d. Symbols indicate significance: p < 0.05 (*) compared to CTRL (C).

