Abstract
Introduction:
Cancer tissue absorbs 3–8 times more glucose than normal tissue. Therefore, we developed a gadobutrol-glucose solution for 7.0T magnetic resonance imaging to visualize whole cancerous regions at high contrast.
Methods:
The contrast medium consists of gadobutrol and glucose solutions, and these solutions are mixed before the vein infusion. We used readily available solutions, and the concentrations of the gadobutrol and glucose solutions were 60% and 5.0%, respectively. To visualize the cancerous region, we used two rabbits with VX7 thigh cancer. First, vein injection was carried out using a gadobutrol-saline solution containing 0.3 ml gadobutrol, and T1-weighted imaging (T1WI) was performed. Twenty-four hours after the first experiment, we performed T1WI of the VX7-cancer region using 50.3 mL gadobutrol-glucose solution including 0.3 ml gadobutrol.
Results:
Compared with T1WI using the gadobutrol-saline solution, the signal intensity of the cancerous region substantially increased using the gadobutrol-glucose solution.
Conclusion:
We confirmed significant signal-intensity increases in the whole VX7-cancer region of a rabbit thigh utilizing vein infusion of gadobutrol-glucose solution since the gadobutrol molecules were absorbed throughout the cancerous region along with glucose molecules.
Keywords: 7.0T magnetic resonance imaging, angiographic effect, cancer visualization, gadobutrol glucose, hypoxic cancer, T1-weighted imaging
INTRODUCTION
Gadolinium (Gd)-based contrast media are used to perform magnetic resonance angiography (MRA),[1] and we usually use the Gd media to perform enhanced Gd-K-edge imaging using photon-counting X-ray computed tomography (PCCT).[2,3,4] Using Gd-K-edge PCCT, fine blood vessels were observed at high contrast, since X-ray photons with energies just beyond Gd K-edge energy can easily be selected.
Cancer tissue absorbs 3–8 times glucose molecules of normal tissue, and the cancerous region can be observed using positron emission tomography[5] using 18F-fluorodeoxyglucose. In this regard, we successfully delivered meglumine-gadopentetate[6] molecules into VX2 cancer[7] in a rabbit thigh using a meglumine-gadopentetate-glucose[8] solution.
Lately, the meglumine gadopentetate with linear chelates was discontinued, and cyclic-chelate gadobutrol,[9] which is less deposited in the brain, was developed. In addition, since Gd-atom concentration per weight was reduced to decrease deposition, the delivering effect of glucose in combination with gadobutrol molecules should be observed.
In the present research, our major objectives are as follows: to develop the gadobutrol-glucose solution, to deliver gadobutrol molecules into the cancerous region using glucose molecules, to reduce the concentration of Gd contrast media per weight, to increase the cancer visualizing duration, and to visualize living-VX7 cancer region in a rabbit thigh. Therefore, we performed T1-weighted imaging (T1WI) of living VX7 cancer using the gadobutrol-glucose solution and 7.0T magnetic resonance imaging (7T-MRI) and observed the signal intensity and visualizing duration.
METHODS
7.0T magnetic resonance imaging
The 7T-MRI scanner (Discovery MR950, GE Healthcare) is shown in Figure 1. This scanner was primarily designed to image human heads, and the inside diameter, length of magnetic field tunnel, and maximum gradient amplitude are 0.60 m, 3.33 m, and 50 mT/m, respectively [Table 1]. Next, 7T-MRI was conducted using a 32-channel head coil (NM008-32-7GE-MR950, GE Healthcare) with an inside diameter of 291 mm.
Figure 1.
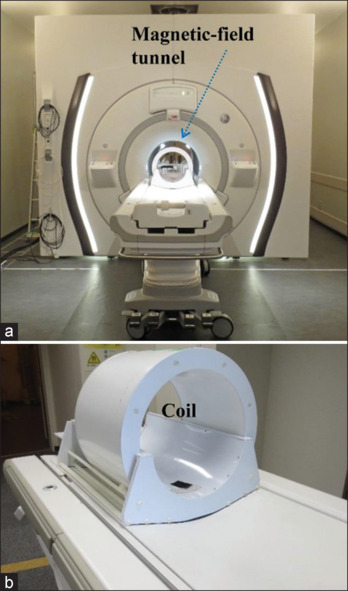
General view of a 7.0T magnetic resonance imaging scanner Discovery MR950. (a) Magnetic field tunnel and (b) send-receiving coil
Table 1.
Characteristics of the 7.0 T magnetic resonance imaging scanner. (a) Discovery MR950, and (b) send-receiving coil for head imaging
| (a) Discovery MR950 | ||
|---|---|---|
| Magnetic flux density (T) Magnet length (m) Magnet bore diameter (m) Maximum gradient amplitude (mT/m) |
7.0 3.33 0.60 50 |
|
|
| ||
| (b) Sending-receiving coil | ||
|
| ||
| Type Inside diameter (mm) Channel number Pixel dimensions for 2D imaging (mm2) |
NM008-32-7GE-MR950 291 32 0.56×0.80 |
|
The sequence of 7T-MRI for observing rabbit VX7 cancer is shown in Table 2. We used a Gd-based contrast medium of gadobutrol and performed high-resolution two-dimensional spin-echo T1WI. The scanning parameters are as follows: a repetition time of 400 ms, an echo time of 10 ms, a field of view of 180 mm, matrix sizes of 320 × 224, and a scanning time of 442 s.
Table 2.
Sequence for observing VX7 cancerous regions using T1-weighted imaging
| Sequence | ||
|---|---|---|
| Imaging method | T1WI | |
| Repetition time (ms) | 400 | |
| Echo time (ms) | 10 | |
| Field of view (mm) | 180 | |
| Matrix size | 320×224 | |
| Slice thickness | 3 mm | |
| Number of slices | 24 | |
| Scanning time (s) | 442 | |
Two experiments
Methods for making gadobutrol-glucose solution are shown in Figure 2. We used readily available solutions, and the concentrations of gadobutrol and glucose solutions were 60% and 5.0%, respectively. First, 0.3 ml gadobutrol solution was measured using a 1.0 ml syringe (SS-01T, Terumo), and its volume was confirmed by three researchers [Figure 2a]. Second, we injected 0.3 ml gadobutrol solution into 50 ml–5.0% glucose solution in a polyethylene bottle [Figure 2b]. Gadobutrol molecules were dispersed in the glucose solution using an ultrasonic cleaning machine for 30 min. Third, we inserted a plastic needle into 50.3 ml gadobutrol-glucose solution [Figure 2c] to perform infusion.
Figure 2.
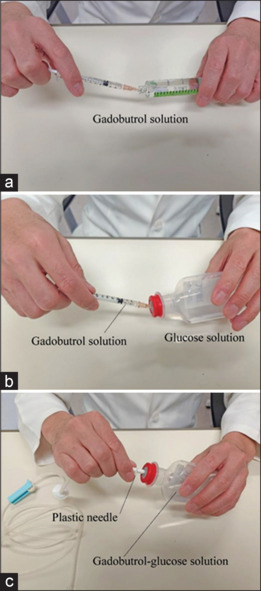
Method for making gadobutrol-glucose solution. (a) Measuring 0.3 ml gadobutrol solution using a 1.0 ml syringe, (b) injecting 0.3 ml gadobutrol solution into 50 ml–5.0% glucose solution in a polyethylene bottle, and (c) inserting a plastic needle into 50.3 ml gadobutrol-glucose solution after dispersing gadobutrol molecules
Table 3 shows methods in two experiments 1 and 2 for observing the angiographic effect of gadobutrol-glucose solution. We used two male rabbits of approximately 3 kg and measured 0.3 ml gadobutrol solutions since the maximum concentration of gadobutrol was 0.1 ml/kg. In experiment 1, we used two solutions of 10 ml gadobutrol-saline and 50.3 ml gadobutrol-glucose. In experiment 1a, we carried out a gadobutrol-saline vein injection from a rabbit ear. Twenty-four hours after injection, gadobutrol-glucose infusion was conducted in experiment 1b. Subsequently, 50.3 ml gadobutrol-saline solution was used to decrease gadobutrol concentration per volume in experiment 2a and was infused from the rabbit ear. Next, an equal-volume gadobutrol-glucose solution was infused in experiment 2b.
Table 3.
Two experiments for observing VX7 cancers. We used 50.3 mL gadobutrol-glucose solutions to enhance cancerous regions in experiments 1b and 2b. In experiment 1a, 10 mL gadobutrol-saline solution was used to observe VX7 cancer using a high gadobutrol concentration per volume. In experiment 2a, we used 50.3 mL gadobutrol-saline solution with a low gadobutrol concentration per volume to compare with the angiographic effect using equal-volume gadobutrol-glucose solution
| Rabbit weight (kg) | Gadobutrol volume (ml) | Medium | ||||
|---|---|---|---|---|---|---|
| Experiment 1(a) | 3.3 | 0.3 | 10.0 ml gadobutrol-saline solution | |||
| Experiment 1(b) | 50.3 ml gadobutrol-glucose solution | |||||
| Experiment 2(a) | 3.4 | 50.3 ml gadobutrol-saline solution | ||||
| Experiment 2(b) | 50.3 ml gadobutrol-glucose solution |
The time relationship between the two experiments is illustrated in Figure 3. In all experiments, T1WI was conducted before infusion (injection), and 10, 30, 60, and 90 min after the infusion. In experiments 1a and 1b, 10 ml gadobutrol-saline injection and 50.3 ml gadobutrol-glucose infusion were carried out over 5 min and 10 min, respectively. In experiments 2a and 2b, the infusion times of 50.3 ml gadobutrol-saline and gadobutrol-glucose solutions were both 30 min.
Figure 3.
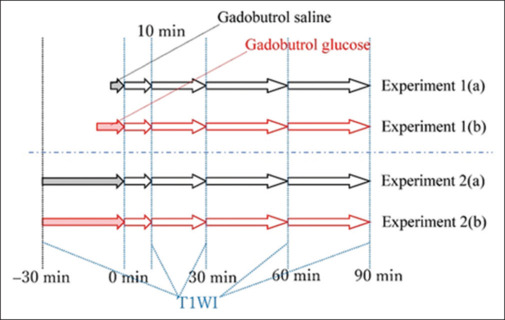
Time relationship in experiments 1 and 2. In experiment 1a, 10 ml gadobutrol-saline solution was injected from a rabbit-ear vein over approximately 5 min. Subsequently, 50.3 ml gadobutrol-glucose solution was infused from the rabbit ear over 10 min in experiment 1b. In experiment 2a, 50.3 ml gadobutrol-saline solution was infused over 30 min. Finally, 50.3 ml gadobutrol-glucose solution was infused over 30 min. In all experiments, T1-weighted imaging was performed before infusion (injection), and 10, 30, 60, and 90 min after infusion
RESULTS
Figure 4 shows a cross-section and T1WI of a rabbit thigh before injection in experiment 1a. Without injection, the VX7 cancerous region was observed at a low contrast. T1WI of a rabbit thigh after 10 ml gadobutrol-saline injection is shown in Figure 5. The signal intensity of the cancerous region maximized at a time of 30 min and decreased slightly as time passed.
Figure 4.
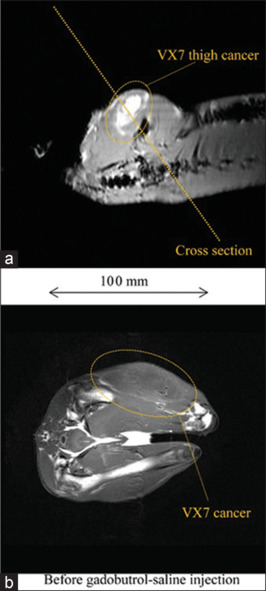
T1-weighted imaging (T1WI) of a 3.3 kg rabbit thigh before experiment 1a. (a) Cross section for T1WI, (b) T1WI of a rabbit thigh before injection of 10 ml gadobutrol-saline solution
Figure 5.
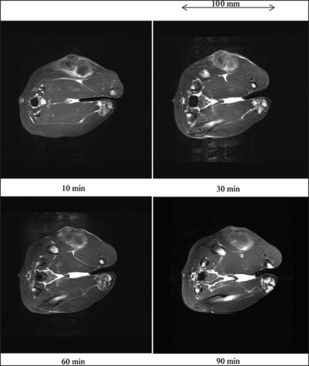
T1-weighted imaging (T1WI) of a 3.3 kg rabbit thigh after injecting 10 ml gadobutrol-saline solution. T1WI was performed at 10, 30, 60, and 90 min after injection in experiment 1a
T1WI of a rabbit thigh before infusing 50.3 ml gadobutrol-glucose solution is shown in Figure 6. Before infusion, the VX7 region was not visible. After infusion, the signal intensity was high and seldom varied with increasing time, and the cancer visualizing duration exceeded 90 min [Figure 7].
Figure 6.
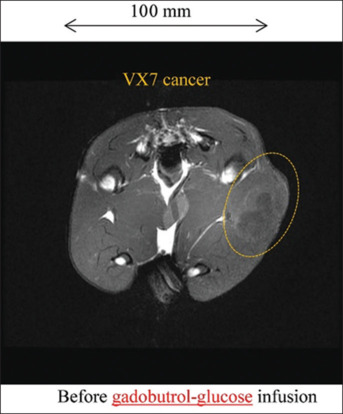
T1-weighted imaging of a rabbit thigh before infusion of gadobutrol-glucose solution
Figure 7.
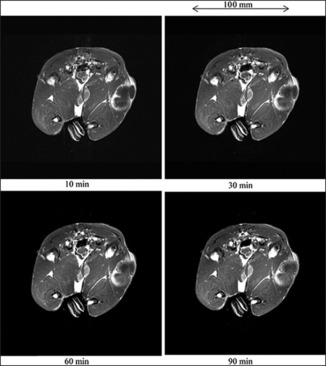
T1-weighted imaging of a 3.3 kg rabbit thigh after infusing 50.3 ml gadobutrol-glucose solution in experiment 1b
The cross-section and T1WI of a rabbit thigh before infusion of 50.3 ml gadobutrol-saline solution are shown in Figure 8. Before infusion, the VX7 cancerous region was observed at a low contrast. With increases in the time after infusion, the signal intensity maximized at a time of 30 min. However, the image contrast was not significantly improved by gadobutrol-saline infusion [Figure 9].
Figure 8.
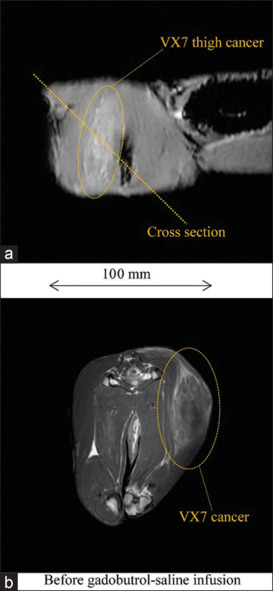
T1-weighted imaging (T1WI) of a 3.4 kg rabbit thigh. (a) Cross section for T1WI, and (b) T1WI of a rabbit thigh before infusing 50.3 ml gadobutrol-saline solution
Figure 9.
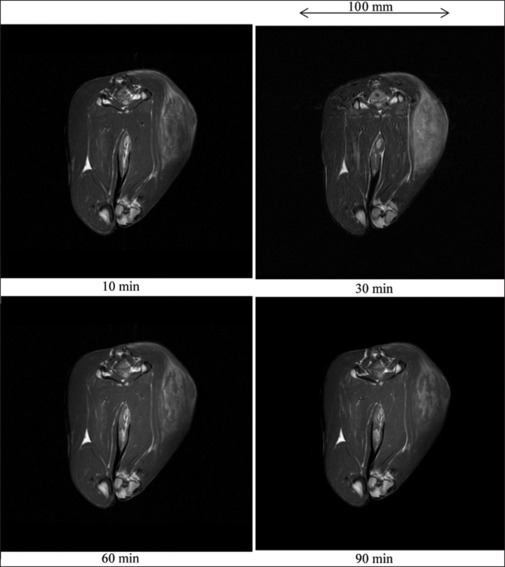
T1-weighted imaging of a 3.4 kg rabbit thigh after infusing 50.3 ml gadobutrol-saline solution in experiment 2a
Figure 10 shows the T1WI of a rabbit thigh before gadobutrol-glucose infusion, we observed VX7 cancerous region at a low contrast. After 50.3 ml gadobutrol-glucose infusion, the signal intensity in the cancerous region was quite high and maximized at a time of 60 min [Figure 11].
Figure 10.
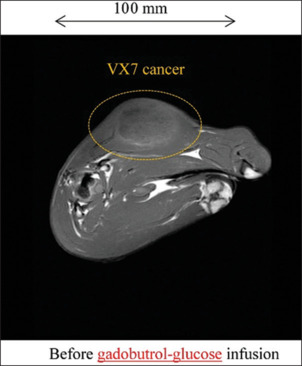
T1-weighted imaging of a rabbit thigh before infusion of 50.3 ml gadobutrol-glucose solution
Figure 11.
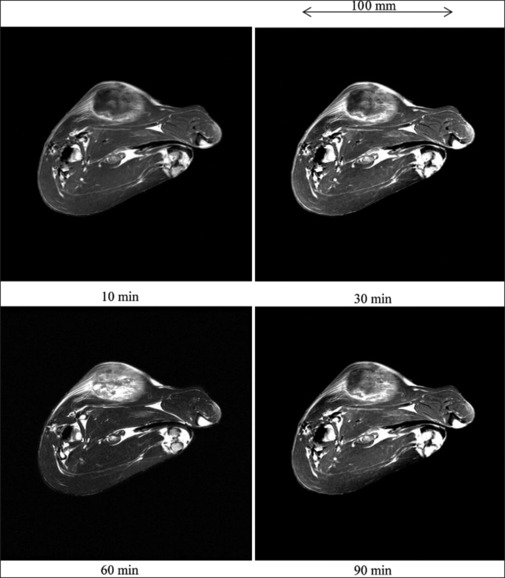
T1-weighted imaging of a 3.4 kg rabbit thigh after infusing 50.3 ml gadobutrol-glucose solution in experiment 2
DISCUSSION
Table 4 shows various characteristics of gadobutrol and glucose molecules. The magnetisms of gadobutrol and glucose are paramagnetism and nonmagnetism, respectively. Considering the molecular weight, since the particle diameters of gadobutrol and glucose are 1 nm and 0.5 nm, respectively, the gadobutrol molecule surrounded by glucose molecules may be absorbed by cancer.
Table 4.
Characteristics of gadobutrol and glucose molecules
| Gadobutrol | Glucose | |||
|---|---|---|---|---|
| Magnetism | Paramagnetism | Nonmagnetism | ||
| Molecular diameter (nm) | Approx. 1 | Approx. 0.5 | ||
| Molecular weight (g) | 604.71 | 180.16 | ||
| Molecular formula | C18H31GdN4O9 | C6H12O6 | ||
| Concentration (%) | 60.5 | 5.0 | ||
| Liquid condition | Aqueous solution | Aqueous solution | ||
| Magnetism of solution | Paramagnetism | Diamagnetism |
In our research, we used a 7T-MRI scanner to improve the spatial and contrast resolutions. In addition, we were able to use only 7T-MRI for animal experiments at our university. However, a clinical 3T-MRI scanner can be used to perform fundamental experiments on whole cancer visualization using the gadobutrol-glucose solution.
Using the head coil, the spatial resolutions of 7T-MRI were primarily determined by the field of view (180 mm) and matrix sizes (320 × 224) and were calculated as 0.56 mm × 0.80 mm, respectively.
In our former animal experiments, we usually used VX2 cancers[8] filled with large amounts of cancer milk. Therefore, we used VX7 cancers with less milk and visualized the inside for this research.
In all experiments, we used three solutions of 10 ml gadobutrol-saline, 50.3 ml gadobutrol-saline, and 50.3 ml gadobutrol-glucose solutions. Particularly, 50.3 ml gadobutrol-saline solution with a low-concentration gadobutrol per volume had little effect in angiography, whereas the effect improved slightly using 10 ml gadobutrol saline.
When 50.3 ml gadobutrol-glucose solution was used at an infusion time of over 10 min, the signal intensity was high and seldom varied with increasing time. In addition, the visualizing duration exceeds 90 min, and the gadobutrol volume may decrease. Furthermore, the angiographic effect was significantly improved when using the gadobutrol-glucose solution with an infusion time of over 30 min. Therefore, the gadobutrol molecules are absorbed into the cancerous region along with glucose molecules. Although we selected the maximum gadobutrol concentration of 0.1 ml/kg, the gadobutrol concentration may be reduced to approximately 0.02 ml/kg in the future.
CONCLUSION
We performed MRA using gadobutrol-glucose solution to observe whole VX7 cancer, including hypoxic regions in a rabbit thigh. The gadobutrol-glucose solution was useful for delivering gadobutrol molecules into cancerous regions along with glucose molecules. Compared with the gadobutrol-saline solution, the angiographic effect of the gadobutrol-glucose solution was quite high. Using the gadobutrol-glucose solution, the cancer visualizing duration was beyond 90 min, and such a technique, which delivers several molecules into cancer along with 0.5-nm-diameter glucose molecules, could be quite useful for cancer treatment.
Author contribution
Data curation: JS. Investigation: JS, KI, HM, TE, RY, SH, YS, and OH. Methodology: ES. Project administration: ES and MW. Supervision: MW and HN. Visualization: SY and KY. Review editing: ES.
Financial support and sponsorship
Nil.
Conflicts of interest
There are no conflicts of interest.
Acknowledgments
This work was supported by Grants from JSPS KAKENHI (17K10371, 17K01424 and 21K12713).
REFERENCES
- 1.Klessen C, Hein PA, Huppertz A, Voth M, Wagner M, Elgeti T, et al. First-pass whole-body magnetic resonance angiography (MRA) using the blood-pool contrast medium gadofosveset trisodium: Comparison to gadopentetate dimeglumine. Invest Radiol. 2007;42:659–64. doi: 10.1097/RLI.0b013e318063c635. [DOI] [PubMed] [Google Scholar]
- 2.Matsukiyo H, Sato E, Oda Y, Yamaguchi S, Sato Y, Hagiwara O, et al. Investigation of quad-energy high-rate photon counting for X-ray computed tomography using a cadmium telluride detector. Appl Radiat Isot. 2017;130:54–9. doi: 10.1016/j.apradiso.2017.09.011. [DOI] [PubMed] [Google Scholar]
- 3.Sato E, Kosuge Y, Yamanome H, Mikata A, Miura T, Oda Y, et al. Investigation of dual-energy X-ray photon counting using a cadmium telluride detector with dual-energy selection electronics. Radiat Phys Chem. 2017;130:385–90. [Google Scholar]
- 4.Moriyama H, Watanabe M, Kusachi S, Oda Y, Sato E. Low-dose low-scattering X-ray computed tomography with high-spatial-energy resolutions using a cooled cadmium telluride detector. Ultramicroscopy. 2019;199:62–9. doi: 10.1016/j.ultramic.2019.01.014. [DOI] [PubMed] [Google Scholar]
- 5.Minoura N, Teramoto A, Ito A, Yamamuro O, Nishio M, Saito K, et al. A complementary scheme for automated detection of high-uptake regions on dedicated breast PET and whole-body PET/CT. Radiol Phys Technol. 2019;12:260–7. doi: 10.1007/s12194-019-00516-8. [DOI] [PubMed] [Google Scholar]
- 6.Peldschus K, Hamdorf M, Robert P, Port M, Graessner J, Adam G, et al. Contrast-enhanced magnetic resonance angiography: Evaluation of the high relaxivity low diffusible gadolinium-based contrast agent P846 in comparison with gadoterate meglumine in rabbits at 1.5 Tesla and 3.0 Tesla. Invest Radiol. 2008;43:837–42. doi: 10.1097/RLI.0b013e3181852158. [DOI] [PubMed] [Google Scholar]
- 7.Chen JH, Lin YC, Huang YS, Chen TJ, Lin WY, Han KW. Induction of V×2 carcinoma in rabbit liver: Comparison of two inoculation methods. Lab Anim. 2004;38:79–84. doi: 10.1258/00236770460734434. [DOI] [PubMed] [Google Scholar]
- 8.Sato E, Yoshida S, Takeda K, Yoshida R, Sato Y, Yoshioka K, et al. Whole cancer-region enhancement using meglumine-gadopentetate-glucose solution and 7.0-T magnetic resonance imaging. Magn Reson Imaging. 2021;81:10–6. doi: 10.1016/j.mri.2021.04.007. [DOI] [PubMed] [Google Scholar]
- 9.Hofmann B, Fischer CO, Lawaczeck R, Platzek J, Semmler W. Gadolinium neutron capture therapy (GdNCT) of melanoma cells and solid tumors with the magnetic resonance imaging contrast agent Gadobutrol. Invest Radiol. 1999;34:126–33. doi: 10.1097/00004424-199902000-00005. [DOI] [PubMed] [Google Scholar]


