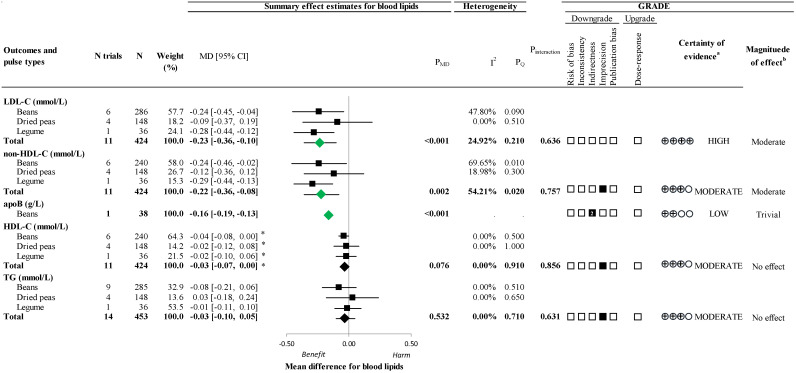
Figure 2.
A summary plot of the effect of extracted pulse proteins on blood lipids in randomized controlled trials. Data are expressed as weighted mean differences with 95% confidence intervals of the summary effect estimates using the generic inverse variance method modeled by random effect (≥5 trial comparisons) or fixed effect (<5 trial comparisons) meta-analyses. The between-study heterogeneity was assessed using the Cochran Q statistic, where PQ < 0.100 was considered statistically significant, and quantified by the I2 statistic, where I2 ≥ 50% was considered evidence of substantial heterogeneity. The effect estimates of total extracted pulse proteins from different sources are denoted as diamonds. The effect estimates of individual extracted pulse protein types are denoted as squares. Any statistically significant reductions are highlighted in green. The grading of recommendations, assessment, development, and evaluation (GRADE) of randomized controlled trials are rated as having a “high” certainty of evidence and can be downgraded by 5 domains and upgraded by 1 domain. The white squares represent no downgrades, filled black squares indicate a single downgrade or upgrade for each outcome, and the black square with a white “2” indicates a double downgrade for each outcome. a Because all included trials were randomized controlled trials, the certainty of the evidence was graded as high for all outcomes by default and then downgraded or upgraded based on prespecified criteria. Criteria for downgrades included risk of bias (ROB) (downgraded if most trials were considered to be at high ROB); inconsistency (downgraded if there was substantial unexplained heterogeneity: I2 ≥ 50%; PQ < 0.10); indirectness (downgraded if there were factors absent or present relating to the participants, interventions, or outcomes that limited the generalizability of the results); imprecision (downgraded if the 95% confidence intervals crossed the minimally important difference (MID) for harm or benefit set at 0.1 mmol/L (5%) for LDL-C, non-HDL-C, HDL-C, and TG and ± 0.04 g/L for apoB [32,33,34,35], or there was a concern with the robustness of the estimate resulting from sensitivity analyses); and publication bias (downgraded if there was evidence of publication bias based on the funnel plot asymmetry and/or significant Egger’s or Begg’s test (p < 0.10) with the confirmation of evidence of small study effects by adjustment using the trim-and-fill analysis of Duval and Tweedie [42]). The criteria for upgrades included a significant dose–response gradient that supports the direction of the pooled effect estimate. Please see Supplemental Table S7 for details on the GRADE assessment. b For the interpretation of the magnitude, we used the MIDs (see a) to assess the importance of the magnitude of our point estimate using the effect size categories according to the new GRADE guidance [51,52,53] as follows: a large effect (≥5× MID); moderate effect (≥2× MID); small important effect (≥1× MID); and trivial/unimportant effect (<1 MID). Please see Supplemental Table S7 for details on the GRADE assessment. * Owing to the difference in the directionality of HDL-C compared with the other outcomes with regards to signal for benefit or harm, the sign for the MD was changed. apoB, apolipoprotein B; CI, confidence interval; GRADE, grading of recommendations, assessment, development, and evaluation; HDL-C, high-density lipoprotein cholesterol; LDL-C, low-density lipoprotein cholesterol; MD, mean difference; N, number; non-HDL-C, non-high-density lipoprotein cholesterol; PMD, p-value of the mean difference; PQ, p-value of the heterogeneity; ROB, risk of bias; TG, triglycerides.

