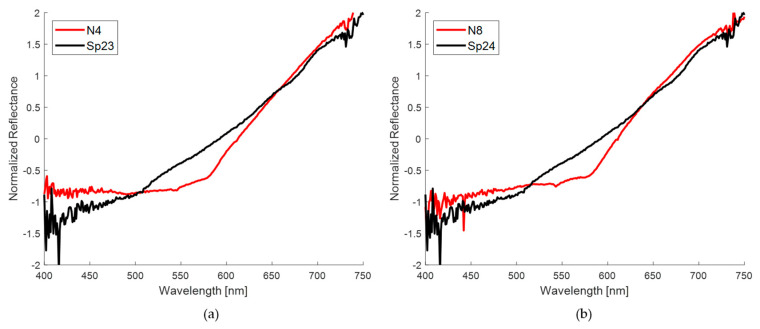
Figure 19.
Spectral comparisons between nevi and spots according to the minimum values of the Mahalanobis distance, calculated from the first five principal components. (a) Comparison between the normalized spectra of the nevus of volunteer 4 and Sp23 spot; (b) comparison between the normalized spectra of volunteer 8’s nevus and Sp24 spot.

