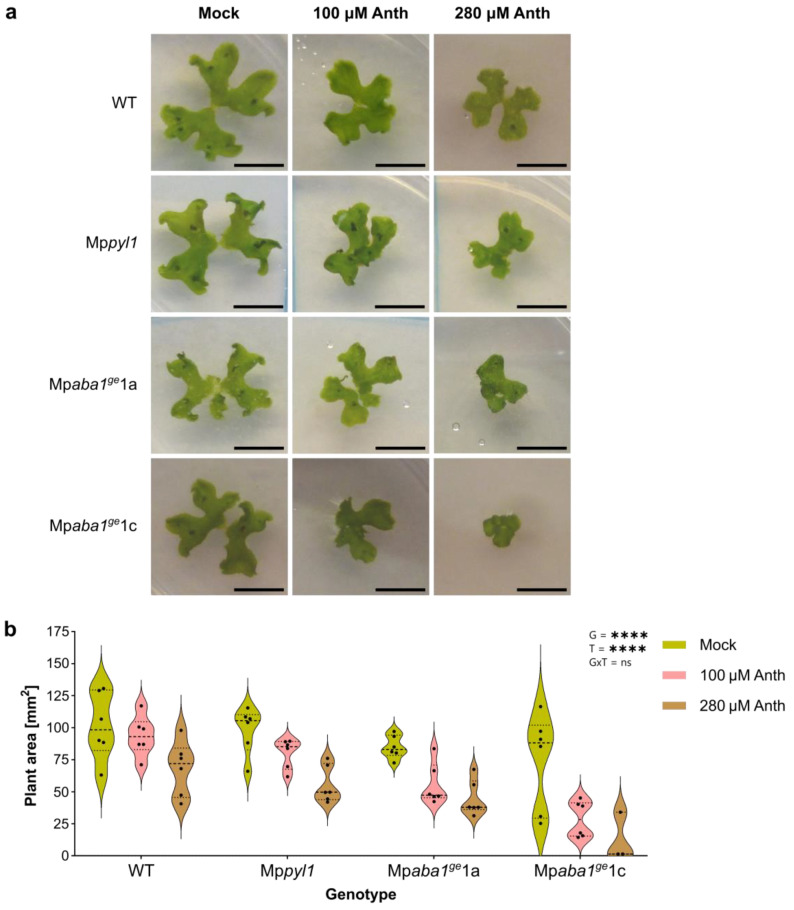
Figure 1.
Dose–response inhibition of anthracene on plant area. M. polymorpha plants of different genotypes (WT, Mppyl1, Mpaba1ge1a, and Mpaba1ge1c) were grown in axenic conditions for 28 days using 0.5X× Gamborg medium supplemented with 100 and 280 μM of anthracene (Anth). Mock plants were used as a control. (a) Representative images of 28-day-old plants treated with anthracene, used for area quantification. Scale bars = 1 cm. (b) Violin plots show the distribution of individual measurements (n = 6). Each data point is the average of one Petri dish containing four plants. The inset values summarize the statistical significance of the main effects of G and T and the GxT interaction. Asterisks denote significant differences (p < 0.001).

