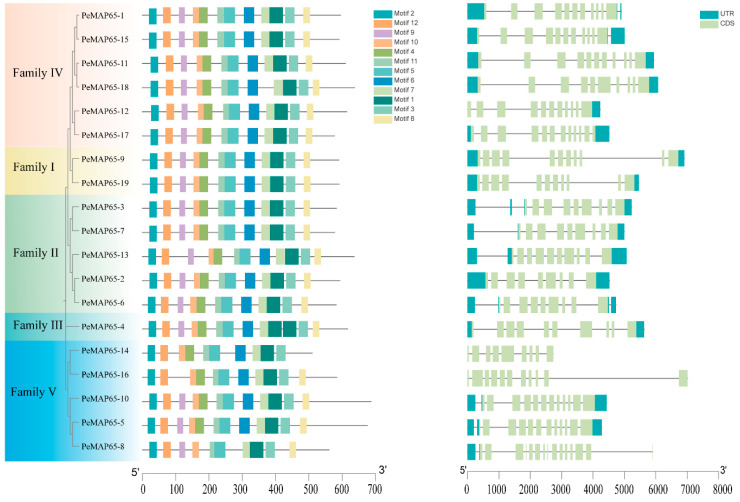
Figure 2.
Conserved motifs and gene structure of PeMAP65s. The motif distribution of MAP65s (left). A total of 12 motifs are represented, each within differently colored boxes. Gene structures of PeMAP65s (right). The light green box represents the exon, the blue-green box represents the UTR, and the black line indicates the intron.

