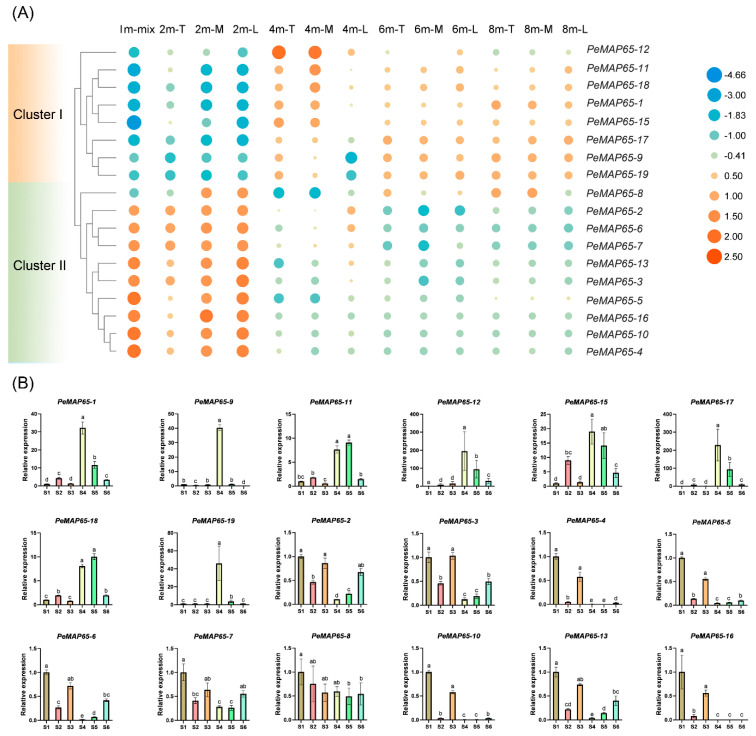
Figure 6.
The expression pattern of PeMAP65s in bamboo shoots with different degrees of lignification. (A) The heatmap represents the expression level (Log2FPKM) of PeMAP65s at the 13th internode of bamboo shoots with different heights. T, M, and L represent the top, middle, and lower portions of the 13th internode. (B) The relative expression levels of PeMAP65s in different internodes of moso bamboo shoots with a height of 2.5 m. S1 represents the 22nd internode. S2 and S3 represent the top and lower portions of the 18th internode. S4 and S6 represent the top, middle, and lower portions of the 13th internode. Data represent means (±SD) of three biological replicates. The different letters indicate significant differences, for which the relative expression level between two samples was greater than or equal to 2.

