
Figure 4: Impact on total, low-and high-density lipoprotein cholesterol, triglyceride and body weight.
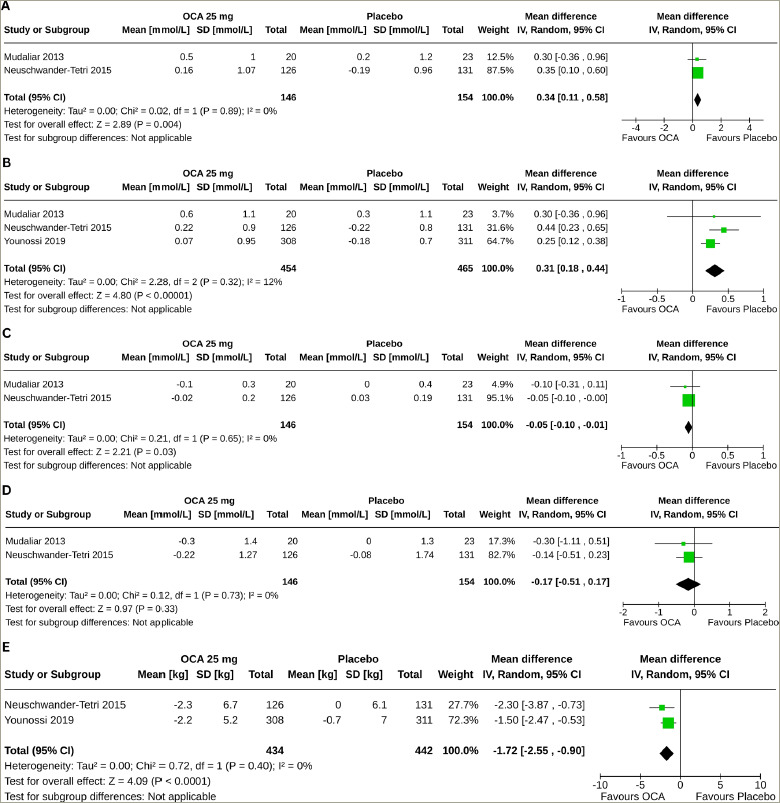
Forest plot highlighting the impact of obeticholic acid and placebo on changes in (A) total cholesterol, (B) low-density lipoprotein cholesterol, (C) high-density lipoprotein cholesterol, (D) triglyceride and (E) body weight from baseline.
CI = confidence interval; df = degrees of freedom; IV = intravenous; OCA = obeticholic acid; SD = standard deviation.