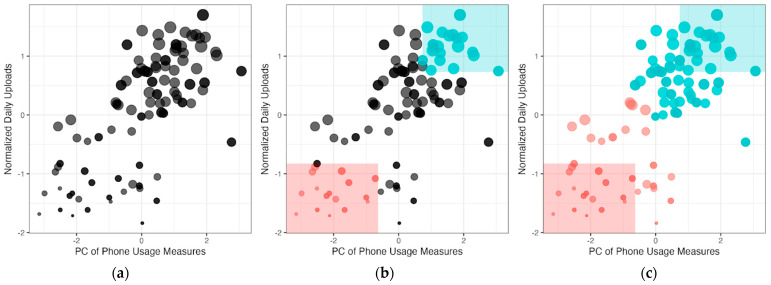
Figure 2.
Step-by-step illustration of the 2SpamH algorithm, where the size of each data point on the constructed feature space represents a daily observation of step count; (a) feature space construction with the first principal component of phone usage measures (x-axis), and the normalized number of step count uploads (y-axis); (b) prototype selection (red = “missing”, blue = “non-missing”); (c) k-nearest neighbors algorithm.

