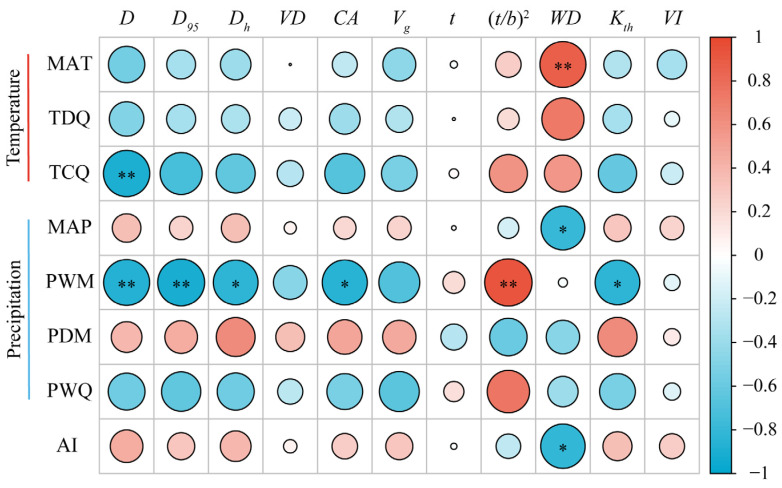
Figure 6.
Relationships between stem xylem hydraulic traits and climatic factors. Notes: The heatmap displays a significant correlation (calculated by Pearson’s correlation analysis). The color of the circle indicates a positive correlation (red) or negative correlation (blue), while color intensity signifies the strength of the correlation. * p < 0.05; ** p < 0.01.

