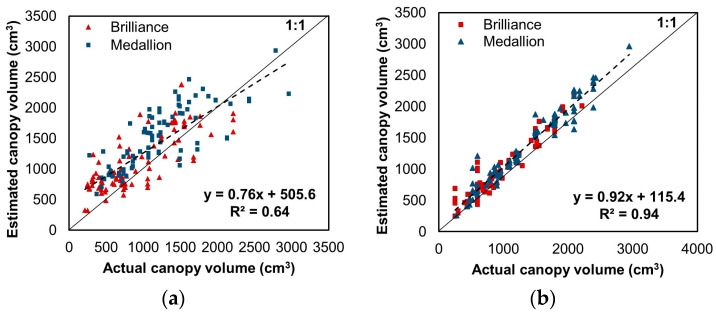
Figure 9.
Comparison of canopy volumes estimated from the developed model and the actual canopy volumes measured using EPS balls, (a) when 100% of canopy volume converted from canopy fullness level was used as target value and (b) when a 50/50 mix of converted canopy volume and canopy volume measured using EPS balls was used as target value. The color indices denote the values for each strawberry variety. The dashed lines show the regression lines.

