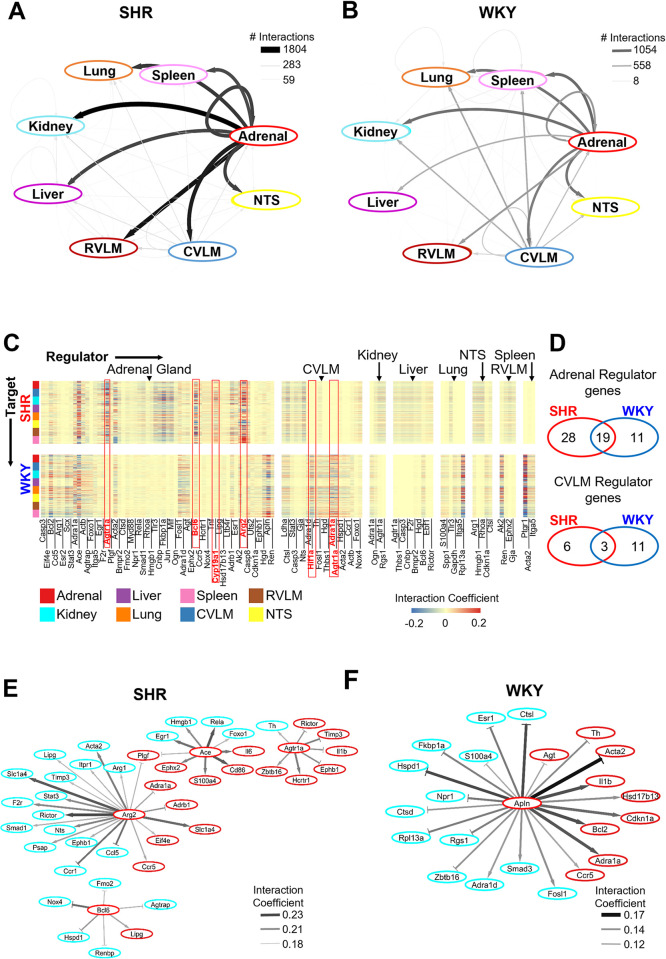
Fig 4. Multi-organ gene regulatory networks in female SHR vs. WKY.
A,B: Network of organ-organ interactions in SHR (panel A) and WKY (panel B). The edge thickness and color are mapped to the number of interaction coefficients that are at least two standard deviations from the mean, as a heuristic threshold for illustrative purposes. C: Heat map of regulatory matrix containing the interaction coefficients that are at least two standard deviations from the mean in female SHR (top) and WKY (bottom). The columns of the matrix correspond to the regulatory genes in the network in any given organ. The rows correspond to the target genes within and across organs. Positive interaction coefficients are colored red in the matrix, while negative interaction coefficients are colored blue. The highlighted columns represent selected key regulators in the network (described in the Results section). D: Total number of times each organ, adrenal gland (top) and CVLM (bottom), shows up as a regulator in panel C in SHR (left), WKY (right) or both (middle). E,F: Network of gene-gene interaction coefficients in SHR (panel E) and WKY (panel F) across adrenal gland and kidney. The edges shown correspond to the absolute interaction coefficients greater than 75% of maximum value (SHR) and 25% of maximum value (WKY). The edge thickness and color are mapped to the level of the interaction coefficients.

