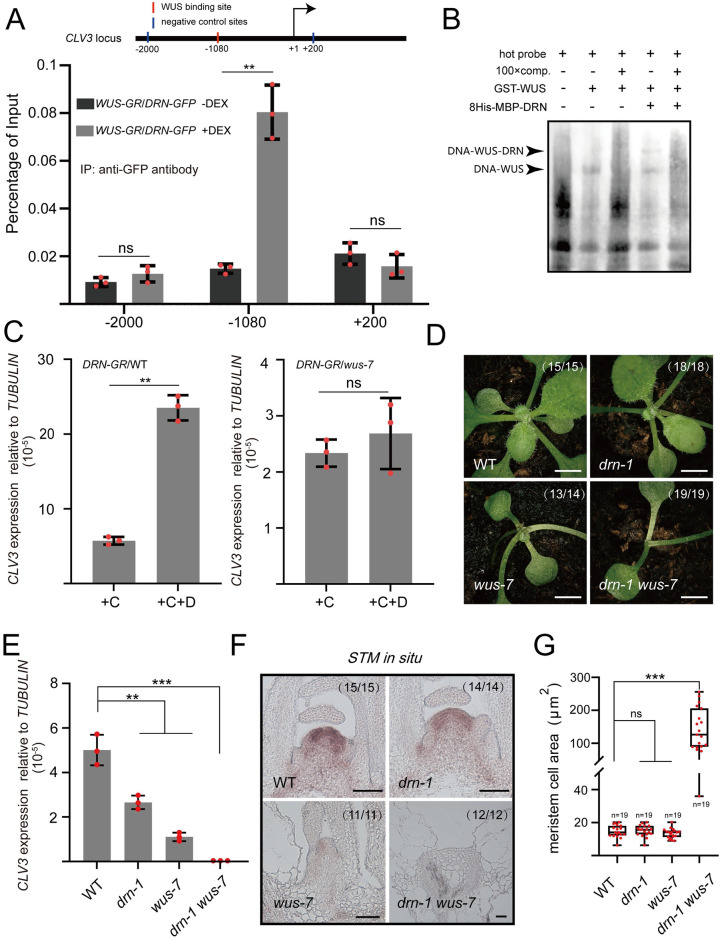
Fig 2. WUS-DRN complex associates with CLV3 promoter to regulate CLV3 expression.
(A) The 14-day-old seedlings were used for ChIP assays. Upon DEX induction, the nuclear localization of WUS-GR enables the association of CLV3 promoter (WUS-binding site, from −1,082 to −1,079) with DRN-GFP, using anti-GFP antibodies for IP. The upstream −2,000 bp site and downstream +200 site acted as negative control loci (no binding site). Two independent experiments were performed with similar results. (B) EMSAs results showing the direct binding of WUS-DRN and the CLV3 promoter fragment enriched in ChIP. The black arrows indicate protein-DNA complexes. Two independent experiments were performed with similar results. (C) qRT-PCR was applied to test the relative transcript level of CLV3 in CLV3::DRN-GR/WT and CLV3::DRN-GR/wus-7 after DEX induction compared with the mock, using 14-day-old seedlings. +C, cycloheximide; +D, dexamethasone. Two independent experiments were performed with similar results. (D) Phenotypes of 14-day-old WT, drn-1, wus-7, and drn-1 wus-7. Scale bars, 1 mm. Two independent experiments were performed with similar results. (E) qRT-PCR was applied to test the relative CLV3 expression in drn-1, wus-7, and drn-1 wus-7 compared with WT, using 14-day-old seedlings. Two independent experiments were performed with similar results. (F) STM expression patterns were checked in SAMs of WT, drn-1, wus-7, and drn-1 wus-7 by RNA in situ hybridization, using 14-day-old seedlings. Scale bars, 50 μm. Two independent experiments were performed with similar results. (G) Meristematic cell sizes of WT, drn-1, wus-7, and drn-1 wus-7 in F were measured by image J software. Black bars, highest and lowest values; box, median 50%; black line in the box, median. Two independent experiments were performed with similar results. ***P < 0.001; **P < 0.01; ns, no significant difference; Student’s t test in A, C, E, and G. Data represent means ± SDs from 3 biological replicates in A, C, and E. The data underlying this figure can be found in S1 Data. ChIP, chromatin immunoprecipitation; DEX, dexamethasone; EMSA, electrophoretic mobility shift assay; SAM, shoot apical meristem.

