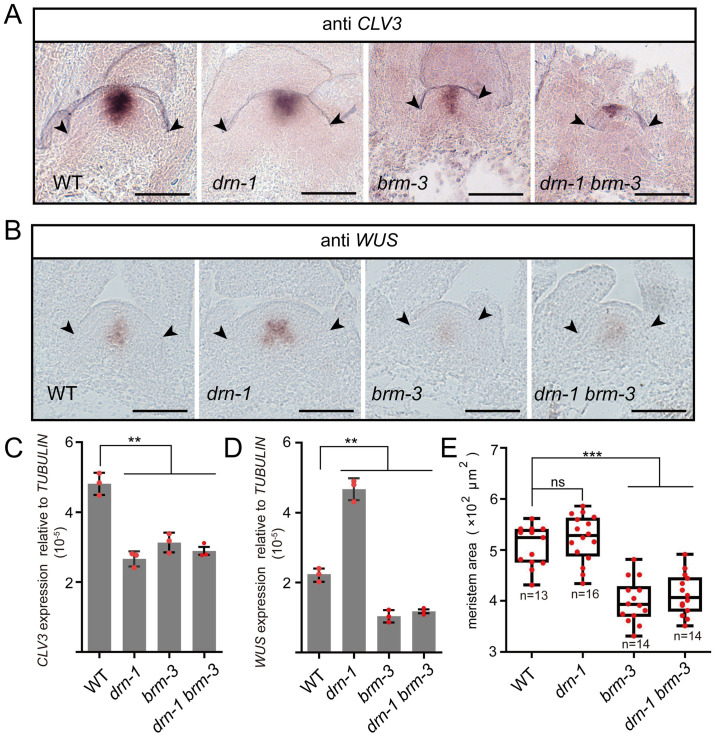
Fig 5. BRM is epistatic to DRN in regulating WUS transcription.
(A) CLV3 mRNAs were checked in SAMs of WT, drn-1, brm-3, and drn-1 brm-3 by RNA in situ hybridization, using 14-day-old seedlings. Scale bars, 50 μm. Two independent experiments were performed with similar results, and 10 samples of each mutant were analyzed. (B) WUS mRNAs were checked in SAMs of WT, drn-1, brm-3, and drn-1 brm-3 by RNA in situ hybridization, using 14-day-old seedlings. Scale bars, 50 μm. Two independent experiments were performed with similar results, and 10 samples of each mutant were analyzed. (C) qRT-PCR was applied to test the relative CLV3 transcript levels of drn-1, brm-3, and drn-1 brm-3 compared with WT, using 14-day-old seedlings. Two independent experiments were performed with similar results. (D) qRT-PCR was applied to test the relative WUS transcript levels of drn-1, brm-3, and drn-1 brm-3 compared with WT, using 14-day-old seedlings. Two independent experiments were performed with similar results. (E) The areas of SAMs in A and B were measured by Image J software. Black bars, highest and lowest values; box, median 50%; black line in the box, median. Two independent experiments were performed with similar results. Black arrows indicate the boundaries of SAMs in A and B. **P < 0.01; ***P < 0.001; ns, no significant difference; Student’s t test in C, D, and E. Data represent means ± SDs from 3 biological replicates in C and D. The data underlying this figure can be found in S1 Data. SAM, shoot apical meristem.

