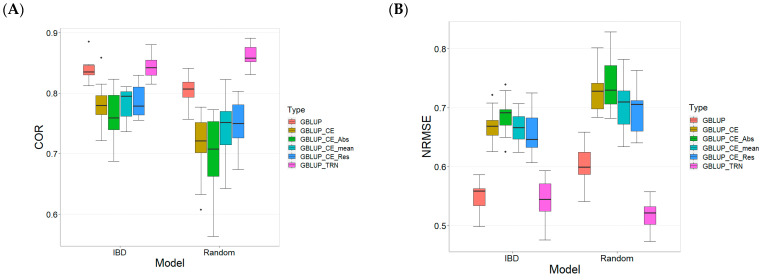
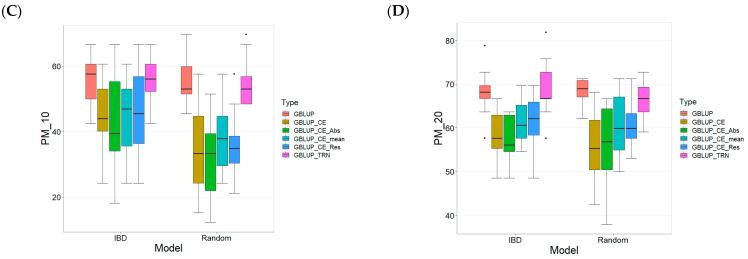
Figure 2.
Comparative Performance of genomic prediction models in terms of Pearson´s correlation (COR) (A), Normalized Root Mean Square Error (NRMSE) (B), Percentage of Matching in top 10% (PM_10) (C), and top 20% (PM_20) (D) for TPE_2_2021_2022, using Incomplete Block Design Cross-Validation and Random Cross-Validation.


