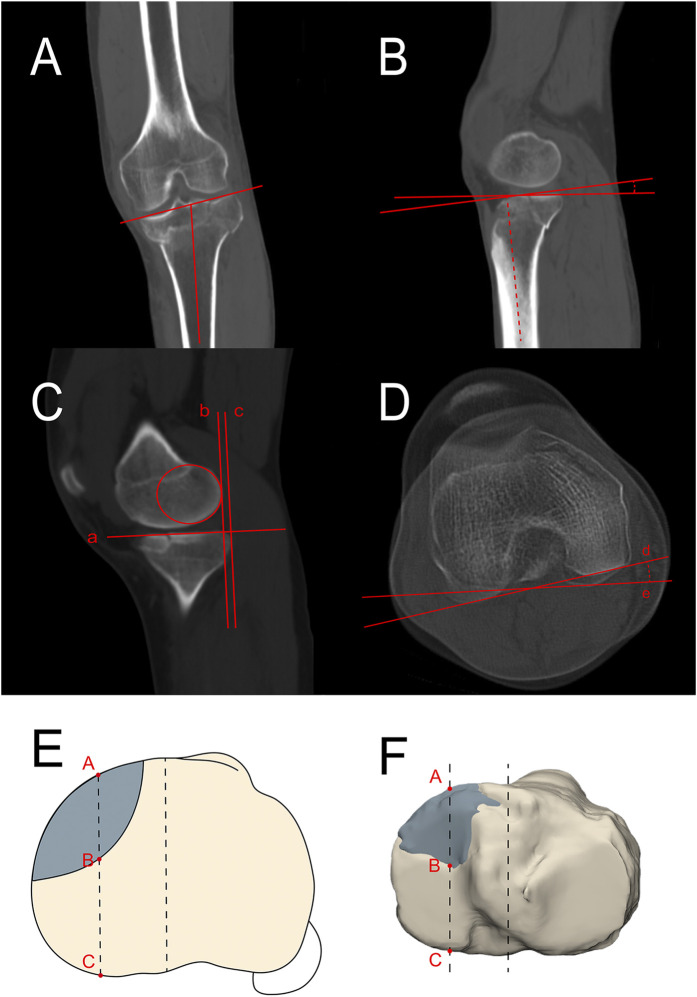
Fig. 2.
Figs. 2-A through 2-F Measurements of the medial proximal tibial angle, the medial and lateral posterior tibial slope, the medial and lateral plateau retreat distance, the rotation angle, and anterior articular surface loss. Fig. 2-A The medial proximal tibial angle is the angle between the tibial plateau surface and the long axis of the tibia in coronal images. Fig. 2-B The posterior tibial slope is the angle between the tibial plateau surface and the line perpendicular to the tibial long axis in sagittal images. Fig. 2-C A best-fit circle over the posterior femoral condyle was drawn on sagittal images, and then the line “a” tangent to the medial and lateral tibial plateau was determined. Two parallel lines perpendicular to line “a” were drawn tangent to the posterior margin of the circle and the tibial plateau, marked as line “b” and line “c.” The distance between line b and line c was regarded as the medial and lateral plateau retreat distance. Fig. 2-D Two axial slices were chosen in which the deepest femoral trochlear groove and the posterior tibial plateau notch were clearly observed. Lines “d” and “e” were drawn tangential to the posterior aspect of the femoral condyle and to the tibial plateau, respectively, and the angle between them was the rotation angle. A positive value of the rotation angle indicates internal rotation of the proximal tibia relative to the distal femur. Figs. 2-E and 2-F Based on the 3D model of the reduced fracture, the transverse diameter of the tibial plateau was quartered and a dashed line was drawn perpendicular to the transverse diameter at the medial quarter of the width. The dashed line intersects the anterior rim of the medial tibial plateau at point “A,” the most posterior point on the fracture line (whether displaced or not) at point “B,” and the posterior margin of the medial tibial plateau at point “C.” The anterior articular surface loss was calculated as AB divided by AC.

