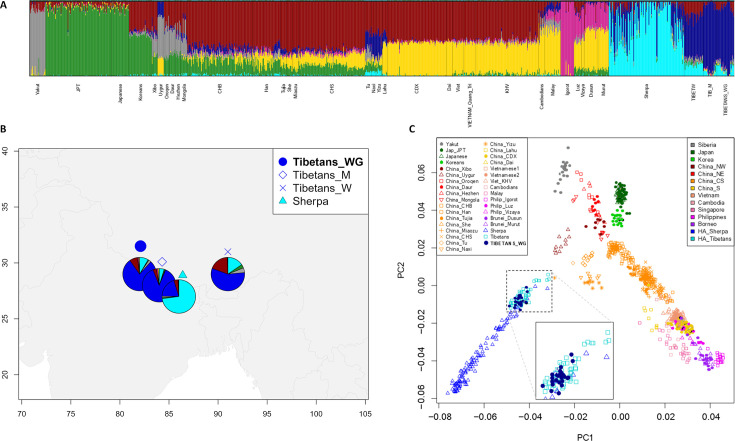
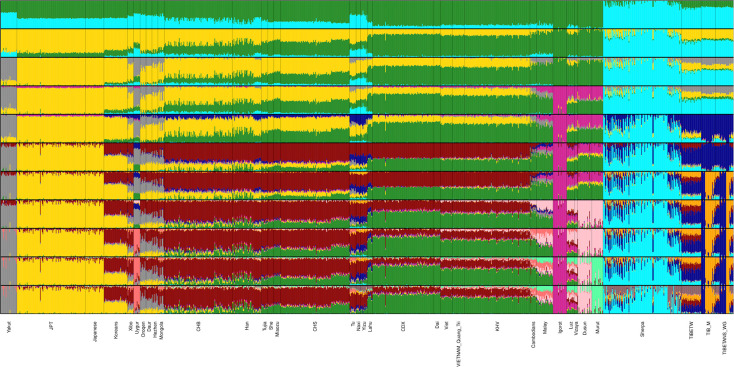
Figure 1. Population structure analyses performed on the extended dataset including Tibetan, Sherpa, and lowland East-Asian individuals.
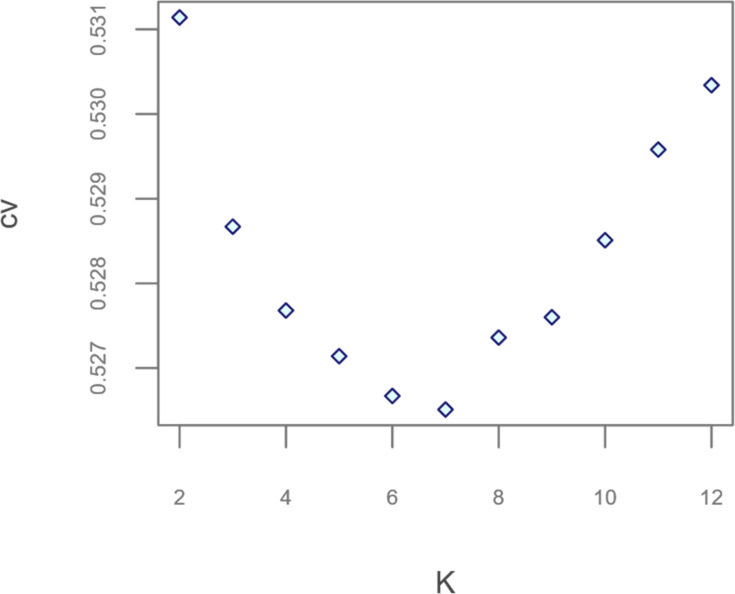
(A) Admixture analysis showed the best predictive accuracy when seven (K = 7) population clusters were tested. Populations included in the dataset are labelled according to population names and acronyms reported in Supplementary file 1a. (B) Map showing geographic location and admixture proportions at K = 7 of the high-altitude groups included in the extended dataset. The label Tibetans_WG indicates whole-genome sequence data for individuals of Tibetan ancestry analysed in the present study. Additional information about the considered samples (e.g., number of individuals per group, reference study, and used abbreviations) are reported in Supplementary file 1a. (C) Principal components analysis (PCA) plot considering PC1 vs PC2 and summarizing genomic divergence between high-altitude Tibetan/Sherpa people and the cline of variation observable for lowland East-Asian populations. The enlarged square displays clustering between Tibetan samples sequenced for the whole genome (i.e., blue dots) and Tibetan samples characterized by genome-wide data (i.e., light-blue squares).


