. 2024 Nov 8;12:RP89815. doi: 10.7554/eLife.89815

Figure 2. Distribution of VolcanoFinder statistics suggestive of putative adaptive introgrossed loci across the TBC1D1 and PRKAG2 genomic regions.

On the x-axis are reported genomic positions of each single-nucleotide variant (SNV), while on the y-axis are displayed the related statistics obtained. Pink background indicates the chromosomal interval occupied by the considered genes, while the grey background identifies those genes (i.e., PGM2 in the TBC1D1 downstream genomic region and the RHEB gene in the upstream PRKAG2 region) possibly involved in regulatory transcription mechanisms. The dashed red line identifies the threshold set to filter for significant likelihood ratio (LR) values (i.e., top 5% of LR values). For both these genomic regions, the distribution of LR and −logα are concordant with those observed at the EPAS1 positive control for adaptive introgression (AI). (A) A total of 50 significant LR values (red stars) and −logα (grey diamonds) values resulted collectively elevated in both the TBC1D1 gene and its downstream genomic regions. A remarkable concentration of significant LR values characterizing 19 SNVs was especially observable in the first portion of the gene. (B) The entire PRKAG2 genomic region was found to comprise 46 SNVs showing significant LR values, with the greatest peaks being located in the downstream region associated to such gene. Peaks detected for the LR statistic are accompanied by peaks of −logα values.

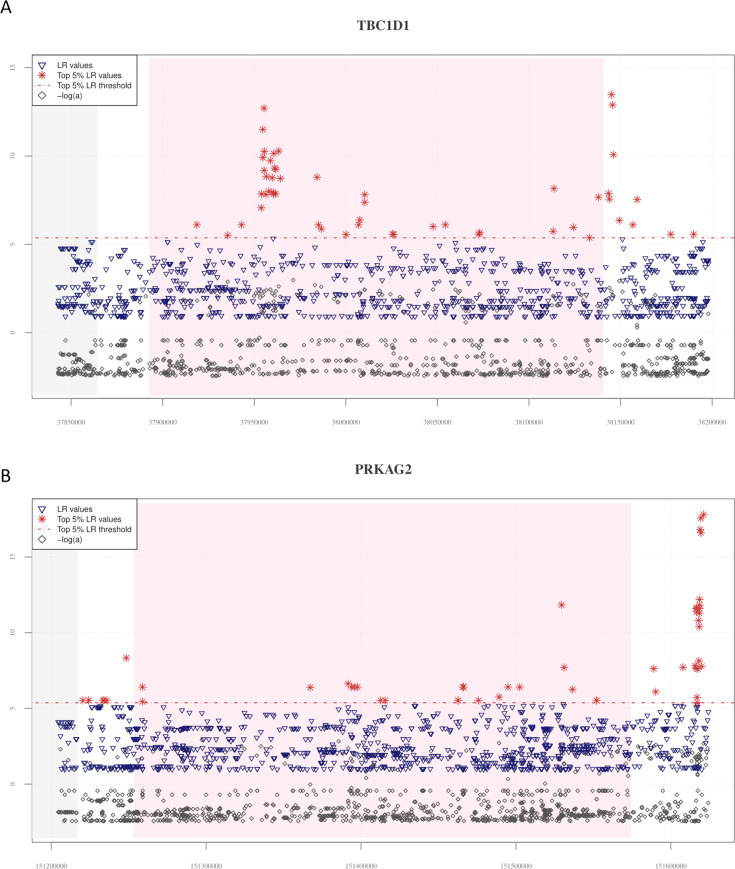
Figure 2.

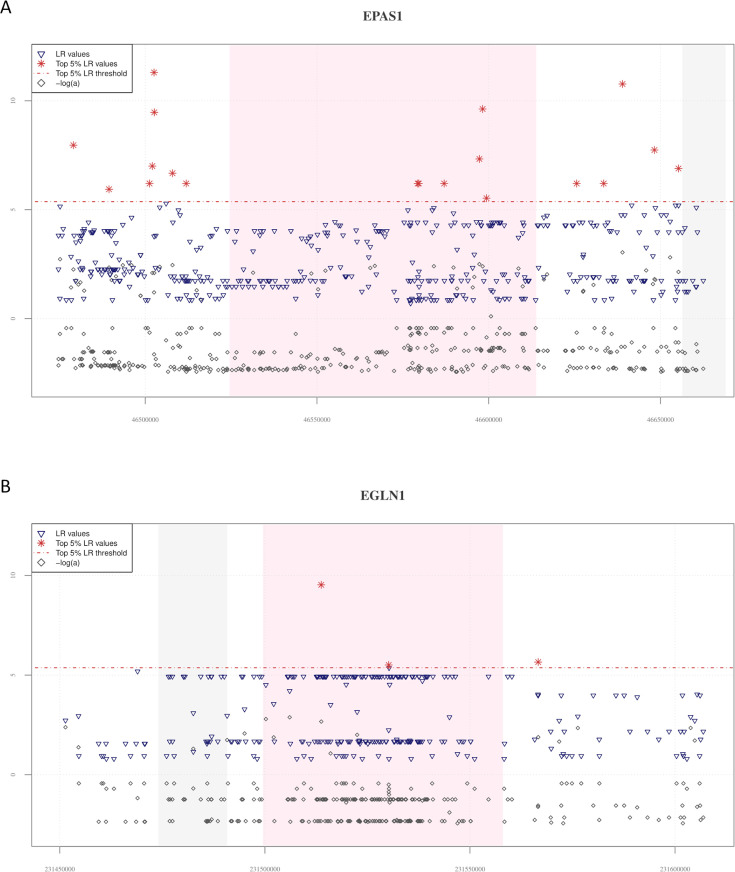
Figure 2—figure supplement 1. Distribution of VolcanoFinder statistics across the EPAS1 and EGLN1 positive and negative controls for adaptive introgression.

Figure 2—figure supplement 1.

In the plots, the chart base reports genomic positions of variants, pink background indicates the starting and the ending positions of the genes, while the grey background identifies those genes (i.e., the LINC02583 gene in the EPAS1 downstream genomic region, the SPRTN gene in the upstream EGLN1 region) possibly involved in regulatory transcription mechanisms. The dashed red line identifies the significant threshold set to filter likelihood ratio (LR) values (i.e., top 5% LR values). (A) The 19 single-nucleotide variants (SNVs) showing significant LR values (i.e., red stars) resulted closely distributed in the ending portion of the EPAS1 gene and in both up- and downstream genomic regions flanking such locus. The −logα values (i.e., grey diamonds) appeared consistently distributed in the entire EPAS1 region. A similar a pattern is observed also for the TBC1D1, PRKAG2, and RASGRF2 new candidate AI genes, as reported in Figure 2A, B and in Figure 2—figure supplement 3. (B) The EGLN1 genomic region is characterized by only three LR significant values among which only one strongly deviates from the significant LR threshold. Several SNVs distributed in the EGLN1 starting portion, as well as in its flaking regions, showed elevated −logα values supporting the action of natural selection on them in the considered Tibetan population.
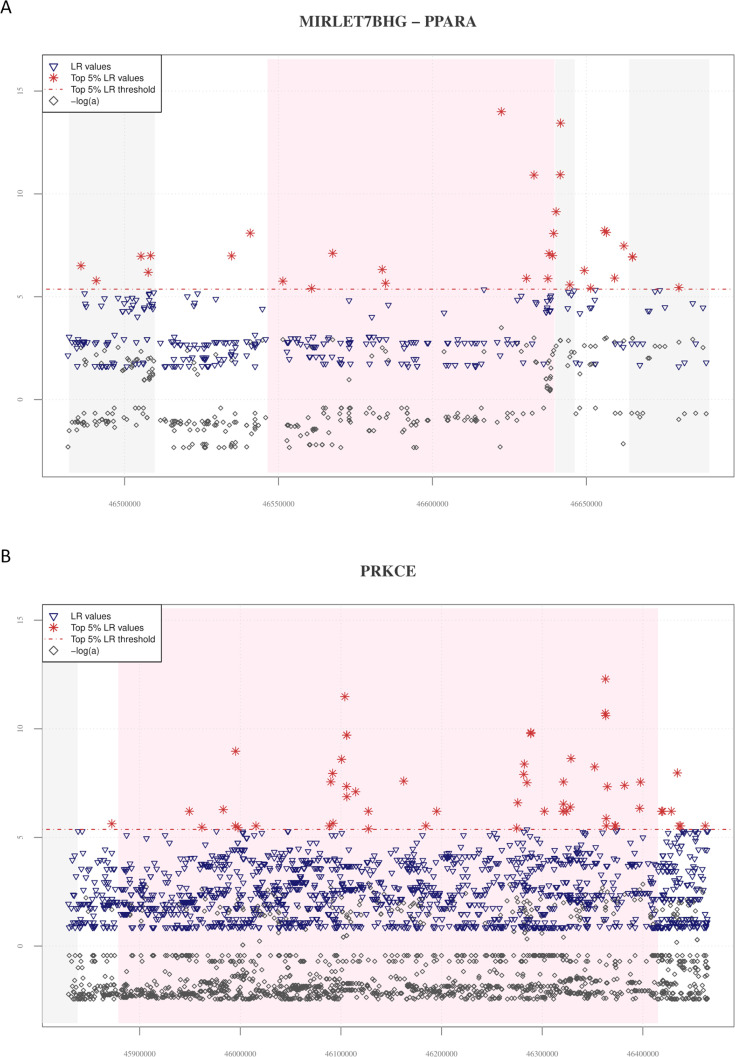
Figure 2—figure supplement 2. Distribution of VolcanoFinder statistics across MIRLET7BHG, PPARA, and PRKCE genes.

Figure 2—figure supplement 2.

In the plots, the chart base reports genomic positions of variants, pink background indicates the starting and the ending positions of the PPARA and PRKCE genes, while the grey background identifies those loci (i.e., MIRLET7BHG long non-coding, CDPF1 and TTC38 genes located in PPARA up- and downstream regions and the SRBD1 gene located in the PRKCE upstream genomic region, respectively) possibly involved in regulatory transcription mechanisms. The red horizontal dashed line displayed the significant threshold set for filtering LR significant values. (A) A total of 32 single-nucleotide variants (SNVs) showed significant LR values (red stars) covering all the genomic region considered. LR greatest peaks are observed in the ending portion of the PPARA gene and in the CDPF1 gene. Collectively, the genomic regions comprising significant LR scores also showed elevated −logα values (grey diamonds). (B) The 55 significant LR scores and the elevated −logα values cover the entire region of the PRKCE gene (i.e., a gene located in a genomic region nearby to EPAS1).
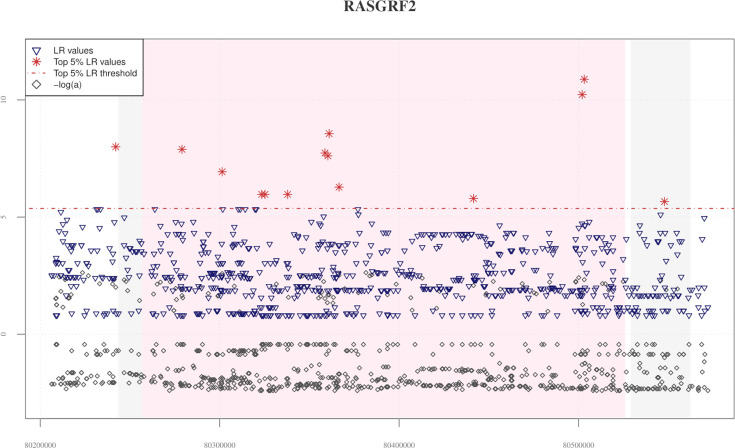
Figure 2—figure supplement 3. Distribution of VolcanoFinder statistics across the RASGRF2 candidate adaptive introgression (AI) gene.

Figure 2—figure supplement 3.

The chart base reports genomic positions of variants, pink background indicates the starting and the ending positions of the RASGRF2 gene, while the grey background identifies those genes (i.e., RASGRF2-AS1 antisense RNA gene and CKMT2 located in the RASGRF2 up- and downstream regions, respectively) possibly involved in regulatory transcription mechanisms. The red horizontal dashed line displayed the significant threshold set for filtering likelihood ratio (LR) significant values. A total of 14 significant LR values (red stars) were equally distributed across the entire genomic region considered, with the greatest peak recovered in the ending portion of the RASGRF2 gene. Elevated peaks of −logα are observable in both RASGRF2 gene and its flanking genomic regions. Such a pattern resulted in line with that observed for the EPAS1 positive control for AI, as reported in Figure 2—figure supplement 1, and for both TBC1D1 and PRKAG2 genomic regions, as reported in Figure 2A, B.
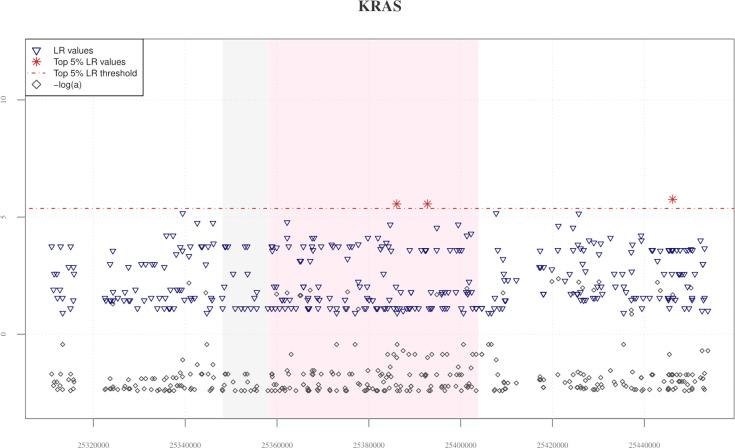
Figure 2—figure supplement 4. Distribution of VolcanoFinder statistics across the KRAS candidate adaptive introgression (AI) gene.

Figure 2—figure supplement 4.

The pink and the grey rectangulars represent the portion of the genome covered by the KRAS and ETFRF1 genes, respectively. Although only three significant likelihood ratio (LR) values can be observed for such a genomic region, the KRAS gene was included in our set of new candidate AI genes because it was confirmed by all the subsequent validation analyses performed and according with previous evidenced advanced by Hu et al., 2017 and Browning et al., 2018, which suggest that a portion of variants included in the KRAS gene, as well as in its downstream region, shows signatures of archaic Denisovan introgression in both Tibetan and CHB populations. Elevated −logα values are instead consistently distributed across the KRAS gene and its surrounding genomic regions.