. 2024 Nov 8;12:RP89815. doi: 10.7554/eLife.89815

Figure 4. Representation of genetic distances between modern and archaic haplotypes and barplots showing haplotype frequency spectra for TBC1D1 and RASGRF2 candidate adaptive introgression (AI) genes.

Haplotypes are reported in rows, while derived (i.e., black square) and ancestral (i.e., white square) alleles are displayed in columns. Haplotypes are ranked from top to bottom according to their number of pairwise differences with respect to the Denisovan sequence. (A) Heatmap displaying divergence between Tibetan, CHB and YRI TBC1D1 haplotypes with respect to the Denisovan genome. A total of 33 TBC1D1 haplotypes (i.e., 61% of the overall haplotypes inferred for such a region) belonging to individuals with Tibetan ancestry are plotted in the upper part of the heatmap thus presenting the smallest number of pairwise differences with respect to the Denisovan sequence. (B) Heatmap displaying divergence between Tibetan, CHB and YRI RASGRF2 haplotypes with respect to the Denisovan genome. A total of 16 Tibetan haplotypes in the RASGRF2 genomic region present no differences with respect to the Denisovan sequence. As regards barplots, on the x-axis are reported the haplotypes detected in the considered genomic windows, while on the y-axis is indicated the frequency for each haplotype. The black and dark-grey bars indicate the more frequent haplotypes (i.e., the putative adaptive haplotypes inferred by the LASSI method), while red stars mark those haplotypes carrying Denisovan-like derived alleles. (C) TBC1D1 haplotype frequency spectrum. The TBC1D1 gene presents a haplotype pattern qualitatively comparable to that observed at EPAS1 (Figure 4—figure supplement 3A), with a predominant haplotype carrying archaic derived alleles and reaching elevated frequencies in Tibetan populations. In line with this observation, such a pattern was inferred by LASSI as conformed with a non-neutral evolutionary scenario, even if it seems to be characterized by a soft rather than a hard selective sweep due to the occurrence of three sweeping haplotypes. (D) RASGRF2 haplotype frequency spectrum. A soft selective sweep was inferred also for the considered RASGRF2 genomic window, although frequencies reached by the sweeping haplotypes turned out to be more similar with each other. The second most represented haplotype was that carrying the archaic derived alleles and, reached a frequency of 29% in the Tibetan group.

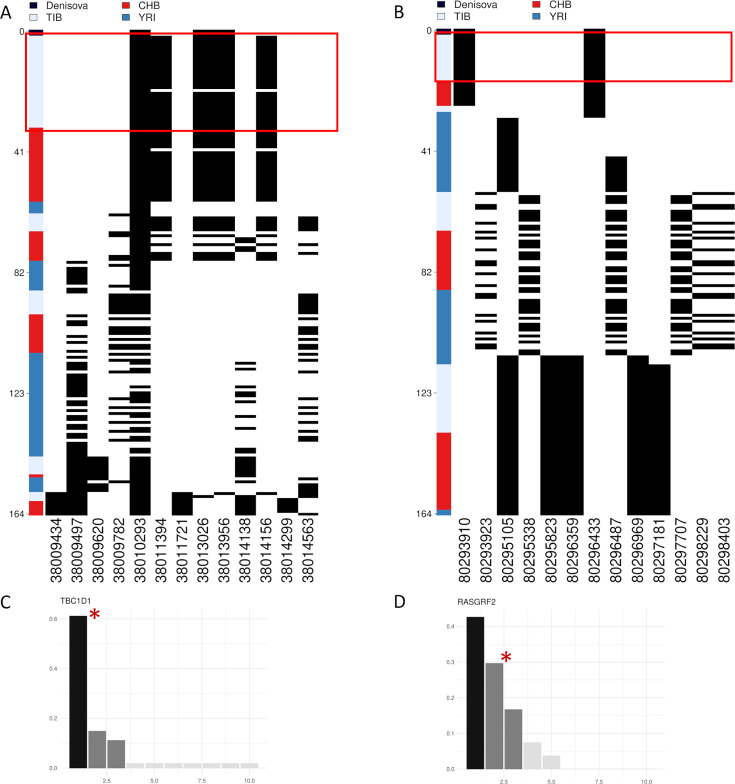
Figure 4.

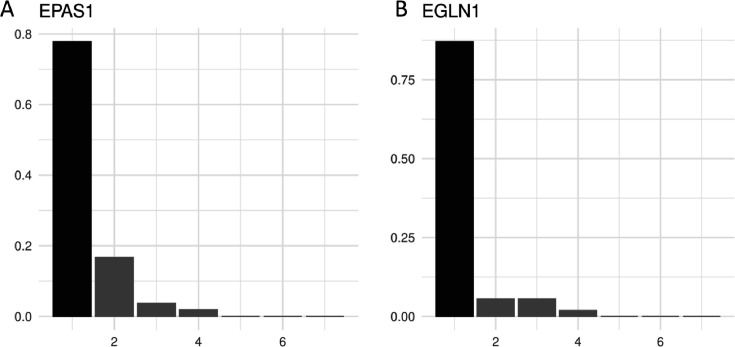
Figure 4—figure supplement 1. Haplotype frequency spectra of the top windows detected as adaptively evolved by LASSI in the EPAS1 and EGLN1 genomic regions.

Figure 4—figure supplement 1.

Barplots showing haplotype frequency spectra in the genomic windows associated with the highest T value and linked to (A) EPAS1 and (B) EGLN1 genes. The x-axis reports the haplotypes detected in the windows, while on y-axes are indicated frequencies of each haplotype. For these windows the haplotype frequency spectra clearly reflect the pattern of diversity expected under the hard selective sweeps model in which a single predominant haplotype carrying adaptive variants (i.e., sweeping haplotypes represented with the black bars) reaches elevated frequencies in the population.
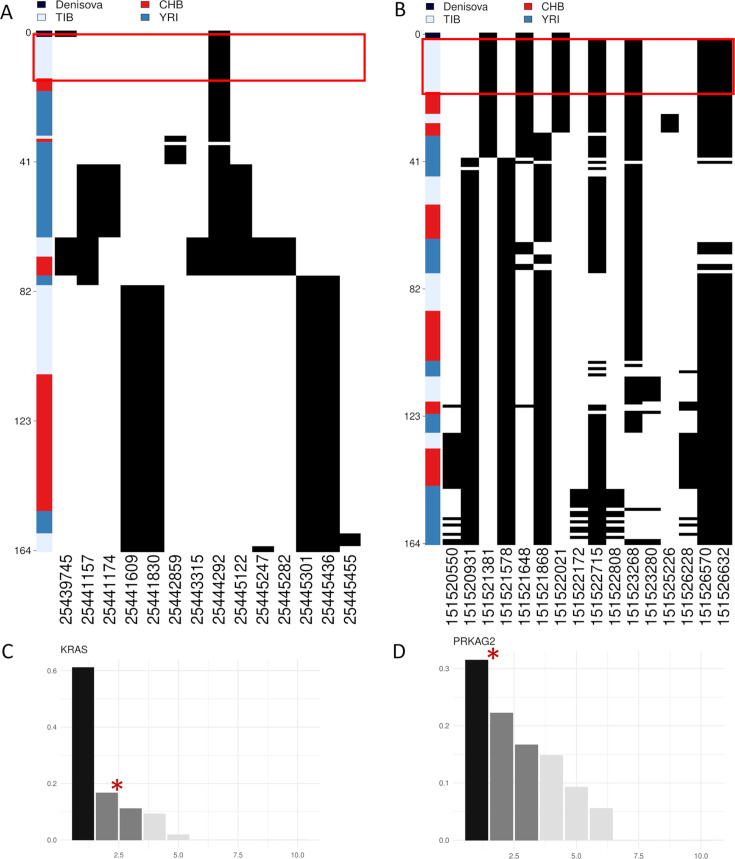
Figure 4—figure supplement 2. Representation of genetic distances between modern and archaic haplotypes.

Figure 4—figure supplement 2.

Heatmap displaying the divergence between Tibetan, CHB and YRI KRAS and PRKAG2 haplotypes with respect to the Denisovan sequence. Haplotypes are reported in rows, while derived (i.e., black square) and ancestral (i.e., white square) alleles are displayed in columns. Haplotypes are ranked from top to bottom according to their number of pairwise differences with respect to the Denisovan sequence. The red square identifies the cluster of Tibetan haplotypes classiefed by the LASSI method as sweeping haplotypes (i.e., haplotypes with elevated or moderate frequencies and which carry putative adaptive variants). (A) 16% of Tibetan haplotypes inferred for KRAS conformed with a non-neutral evolutionary scenario according to LASSI results and presented the smallest number of pairwise differences with respect to the Denisovan genome, being plotted in the upper part of the heatmap. (B) 33% of Tibetan PRKAG2 haplotypes cluster in the upper part of the heatmap being among the most close haplotypes with respect to the Denisovan sequence and presenting only four pairwise differences with it. Barplots showing haplotype frequency spectrum of KRAS and PRKAG2 windows suggestive of adaptations mediated by soft selective sweeps in Tibetans. In both the plots are reported on the x-axis the haplotypes detected in the considered windows, while on y-axes are indicated the frequencies of each haplotype. The black and dark-grey bars indicate the more frequent haplotypes (i.e., the sweeping haplotypes inferred by LASSI), while the red star marks those haplotypes carrying Denisovan-like derived variants. (C) KRAS presents a pattern qualitatively comparable to that expected for a non-neutral evolution (i.e, positive likelihood T values), with two main haplotypes carrying putative adaptive variants and reaching elevated frequencies in Tibetans. The second sweeping haplotype carries the Denisovan-like derived variant and reaches 16% of frequency. (D) The most frequent sweeping haplotype detected in this PRKAG2 window reches 33% of frequency in Tibetans and carries the Denisovan-like derived variant.
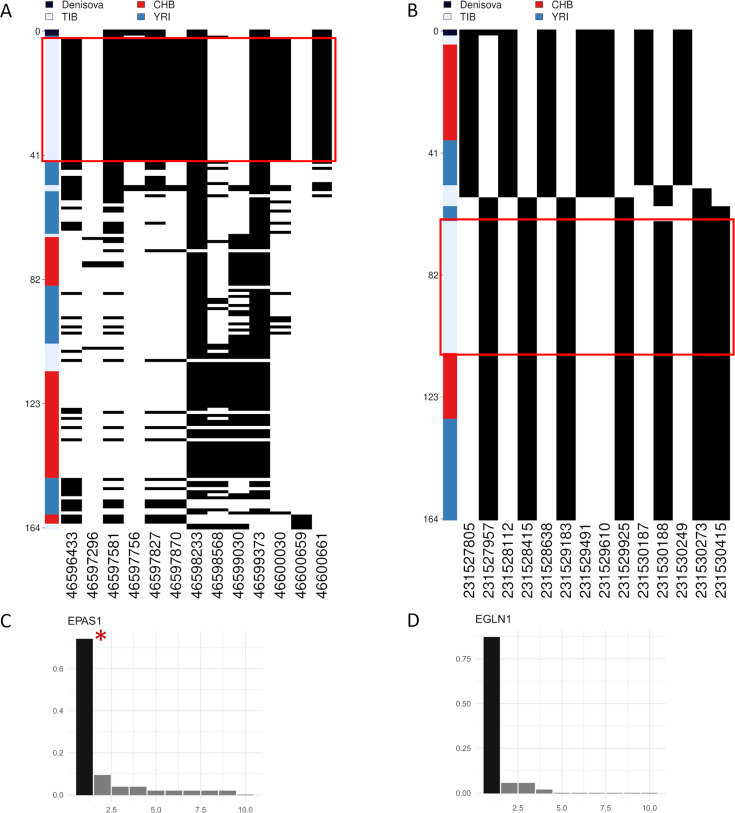
Figure 4—figure supplement 3. Representation of genetic distances between modern and archaic haplotypes.

Figure 4—figure supplement 3.

Heatmap displaying the divergence between Tibetan, CHB and YRI EPAS1 and EGLN1 haplotypes with respect to the Denisovan sequence. Haplotypes are reported in rows, while derived (i.e., black square) and ancestral (i.e., white square) alleles are displayed in columns. Haplotypes are ranked from top to bottom according to their number of pairwise differences with respect to the Denisovan sequence. The red square identifies the cluster of Tibetan haplotypes classified by LASSI as sweeping haplotypes (i.e., haplotypes with elevated or moderate frequencues which carry putative adaptive variants). (A) The first homogeneus cluster of haplotypes visible in upper part of the heatmap belongs to Tibetan individuals (i.e., light-blue cluster). These haplotypes are among the closest ones to the archaic Denisovan sequence indicated in black, thus confirming archaic introgression at EPAS1. As concerning the haplotypes inferred for the other population in the plot, only one YRI haplotype presents one pairwise difference less than the haplotypes in the first Tibetan cluster. (B) Except for two Tibetan haplotypes, which appeared the closest ones to the archaic reference, the cluster of haplotypes presenting the lowest number of differences with respect to the Denisovan sequence belongs to the Han Chinese population. The most frequent Tibetan haplotype did not present any variant shared with the archaic reference, counting 14 pairwise differences with respect to Denisovan genome and thus not supporting the archaic origin of these EGLN1 variants. Barplots showing the haplotype frequencies spectrum of the (C) EPAS1 and (D) EGLN1 windows suggestive of adaptation mediated by hard selective sweeps in Tibetans. In both the plots are reported on the x-axis the haplotypes detected in the considered windows, while on y-axes are indicated the frequencies of each haplotype. The black and dark-grey bars indicate the more frequent haplotypes (i.e., sweeping haplotypes inferred by LASSI), while the red star marks those sweeping haplotypes carrying Denisovan-like derived variants. For these windows, haplotype frequency spectra clearly reflect patterns expected under the hard selective sweep model in which a single haplotype carrying adaptive variants (i.e., sweeping haplotypes represented with the black bars) reaches elevated frequencies in the population. However, only for EPAS1 such haplotype effetively carries the Denisovan-like derived variant.