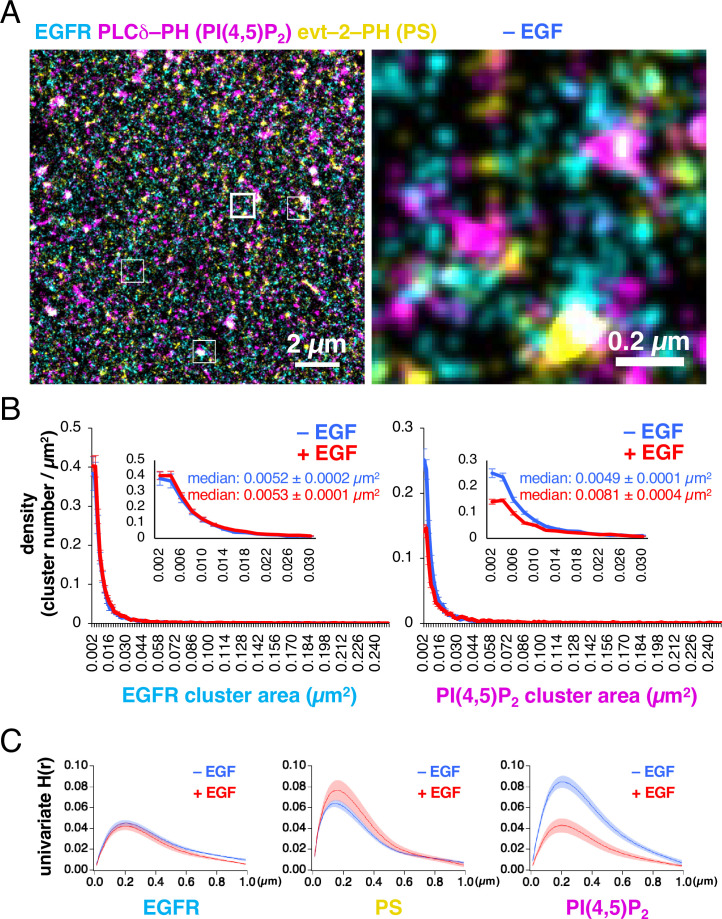
Figure 1. Epidermal growth factor receptor (EGFR), PI(4,5)P2, and phosphatidylserine (PS) are distributed nonrandomly in the plasma membrane.
(A) Images of EGFR–rsKame (cyan), PAmCherry–PI(4,5)P2 (magenta), and HMSiR–PS (yellow) before epidermal growth factor (EGF) stimulation. PAmCherry–PI(4,5)P2 and Halo–evt2–PH (Halo–PS) were transiently expressed in a cell line stably expressing EGFR–rsKame. Cells were incubated in serum-free medium in the presence of the HMSiR–Halo ligand overnight and treated with paraformaldehyde and glutaraldehyde. Left, a typical image of 15×15 µm. Right, enlarged image of the square region surrounded by a bold line in the left image. Enlarged images of other square regions surrounded by thin lines in the left image are shown in Figure 1—figure supplement 2C. (B) Distribution of the densities of EGFR (left) and PI(4,5)P2 cluster areas (right). Cells were incubated in serum-free medium overnight, stimulated with or without 20 nM EGF for 1 min, and treated with paraformaldehyde and glutaraldehyde. From the single-molecule localization microscopy (SMLM) images, the cluster areas and the number of clusters were measured. After the cluster number was normalized to the cell area (density), the cluster density was plotted as a function of the cluster area. Inset, enlarged graphs for the cluster areas of <0.03 µm2. Blue and red indicate before and after EGF stimulation, respectively. Data are means ± SEM of at least eight cells. (C) Univariate H(R) values of EGFR–rsKame (left), PAmCherry–PI(4,5)P2 (middle), and HMSiR–PS (right) in cells incubated in the absence (blue) or presence (red) of 20 nM EGF for 1 min. Ripley’s univariate H-function was calculated from the SMLM images. Data are means ± SEM of nine (EGFR–rsKame and PAmCherry–PI(4,5)P2) or 10 (HMSiR–PS) cells.


