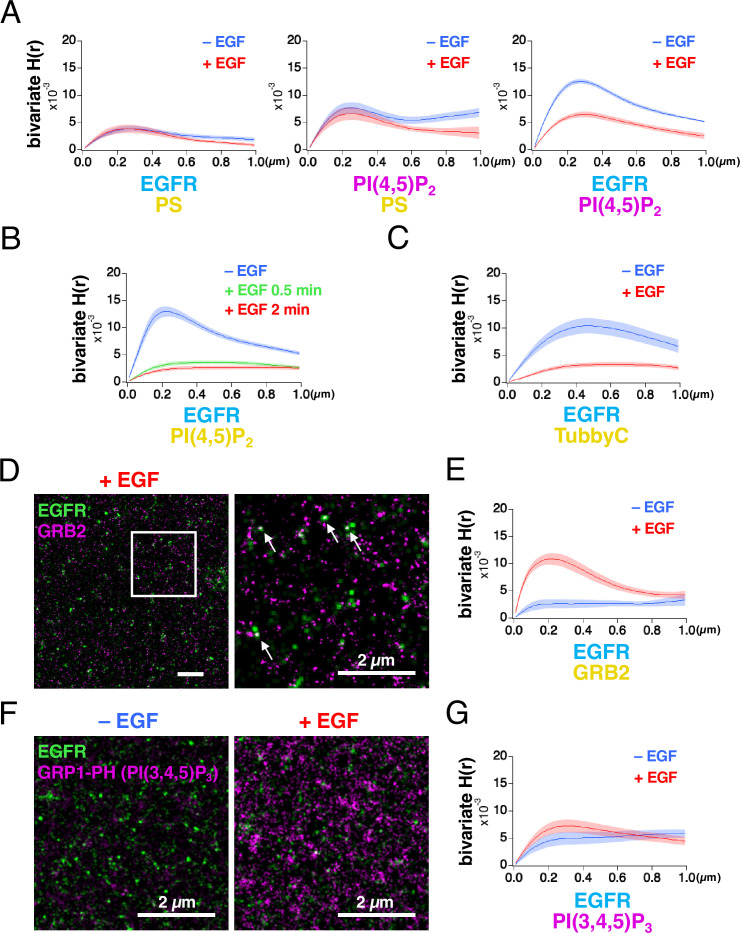
Figure 2. Bivariate H(r) calculated from SMLM images reveals that lateral coaggregation of epidermal growth factor receptor (EGFR) and PI(4,5)P2 decreases after epidermal growth factor (EGF) stimulation.
(A) Bivariate H(r) value of EGFR–rsKame and HMSiR–PS, PAmCherry–PI(4,5)P2 and HMSiR–PS, and EGFR–rsKame and PAmCherry–PI(4,5)P2 before (blue) and after incubation with 20 nM EGF for 1 min (red). Cells were prepared as in Figure 1. Ripley’s bivariate H-function was calculated from the single-molecule localization microscopy (SMLM) images. Data are means ± SEM of eight cells. (B) Bivariate H(r) value of EGFR–rsKame and HMSiR–PI(4,5)P2 before (blue) and after incubation with 20 nM EGF for 0.5 min (green) or 2 min (red). Halo–PI(4,5)P2 was transiently expressed in a cell line stably expressing EGFR–rsKame. Cells were incubated in serum-free medium in the presence of the HMSiR–Halo ligand overnight, stimulated with or without 20 nM EGF for the indicated times, and treated with paraformaldehyde and glutaraldehyde. Data are means ± SEM of 17 (without EGF stimulation), 10 (with EGF stimulation for 0.5 min), or 20 cells (with EGF stimulation for 2 min). (C) Bivariate H(r) value of EGFR–rsKame and HMSiR–TubbyC before (blue) and after incubation with 20 nM EGF for 2 min (red). Halo–TubbyC was transiently expressed in a cell line stably expressing EGFR–rsKame. Data are means ± SEM of 8 (without EGF stimulation) or 13 cells (with EGF stimulation for 2 min). (D) Images of EGFR–rsKame (green) and HMSiR–GRB2 (magenta) after EGF stimulation for 2 min (right). Halo–GRB2 was transiently expressed in a cell line stably expressing EGFR–rsKame. Right, enlarged image of the square region surrounded by a bold line in the left image. Arrows indicate EGFR and GRB2 overlaps in the images. (E) Bivariate H(r) value of EGFR–rsKame and HMSiR–GRB2 before (blue) and after incubation with 20 nM EGF for 2 min (red). Halo–GRB2 was transiently expressed in a cell line stably expressing EGFR–rsKame. Data are means ± SEM of 10 cells. (F) Images of EGFR–rsKame (green) and PAmCherry–PI(3,4,5)P3 (magenta) before (left) and after EGF stimulation for 2 min (right). PAmCherry1–GRP1-PH (PAmCherry–PI(3,4,5)P3) was transiently expressed in a cell line stably expressing EGFR–rsKame. (G) Bivariate H(r) value of EGFR–rsKame, and PAmCherry–PI(3,4,5)P3 before (blue) and after incubation with 20 nM EGF for 2 min (red). Data are means ± SEM of 10 (before EGF stimulation) or nine cells (after 20 nM EGF stimulation).

