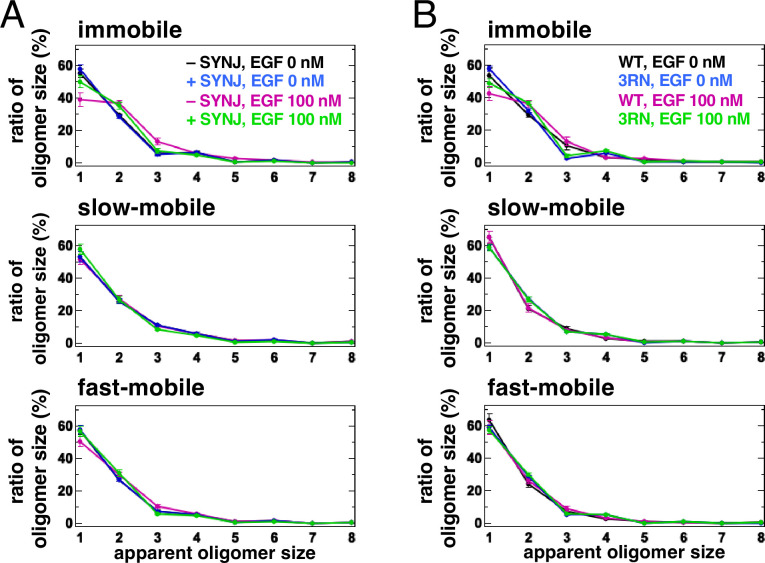
Figure 4. Single-molecule tracking (SMT) analysis shows that PI(4,5)P2 is important for stabilizing epidermal growth factor receptor (EGFR) dimers.
(A) SMT analysis of EGFR–SF650 in control and synaptojanin (SYNJ)-expressing cells. Only EGFR–Halo or both EGFR-Halo and green fluorescent protein (GFP)–SYNJ were transiently expressed in Chinese Hamster Ovary (CHO)-K1 cells. After cells were incubated in a serum-free medium overnight, EGFR–Halo was stained with the SF650–Halo ligand. EGFR–SF650 was observed in control (n=40) and SYNJ-expressing cells (n=40) at a time resolution of 30 ms before epidermal growth factor (EGF) stimulation. Following stimulation with 100 nM EGF, EGFR–SF650 was observed in the same cells between 1 and 6 min after the addition of EGF. (B) SMT analysis of EGFR(WT)–SF650 and EGFR(3RN)–SF650. EGFR–Halo or EGFR(3RN)–Halo was transiently expressed in CHO-K1 cells. After the cells were incubated in a serum-free medium overnight, EGFR–Halo was stained with the SF650–Halo ligand. EGFR(WT)–SF650 (n=40) and EGFR(3RN)–SF650 (n=45) were observed as described in (A). Data are means ± SEM.


