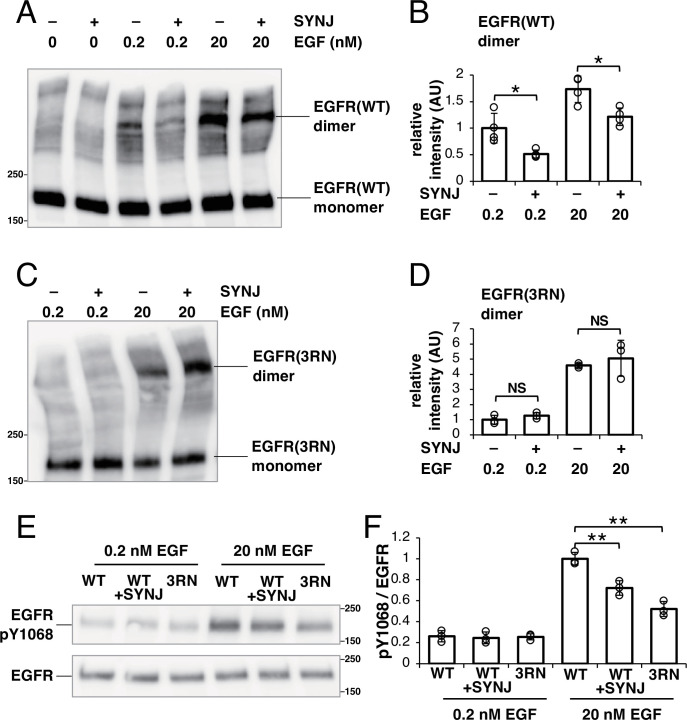
Figure 5. PI(4,5)P2 is important for not only the dimerization of epidermal growth factor receptor (EGFR) but also its subsequent phosphorylation.
(A) Western blotting analysis of crosslinked EGFR. After EGFR-knockout (KO) cells were transfected with only EGFR–Halo or both EGFR–Halo and green fluorescent protein (GFP)–synaptojanin (SYNJ), the cells were incubated in a serum-free medium overnight. The cells were then stimulated with 0, 0.2, or 20 nM epidermal growth factor (EGF), and treated with a crosslinker for 1 hr. EGFR–Halo was detected with an anti-EGFR antibody. (B) Amounts of EGFR–Halo dimer. Relative intensity was normalized to the mean intensity of lane #3 in (A). Data are means ± SD of four experiments. (C) Western blotting analysis of crosslinked EGFR(3RN). After EGFR-KO cells were transfected with only EGFR(3RN)–Halo or both EGFR(3RN)–Halo and GFP–SYNJ, the cells were incubated in a serum-free medium overnight. The cells were then stimulated with 0.2 or 20 nM EGF, and treated with a crosslinker for 1 hr. EGFR(3RN)–Halo was detected with an anti-EGFR antibody. (D) Amounts of EGFR(3RN)–Halo dimer. Relative intensity was normalized to the mean intensity of lane #1 in (C). Data are means ± SD of three experiments. (E) Western blotting analysis of phosphorylated EGFR and total EGFR. After EGFR-KO cells were transfected with EGFR(WT)–Halo, EGFR(WT)–Halo, and GFP–SYNJ, or EGFR(3RN)–Halo, the cells were incubated in serum-free medium overnight and stimulated with 0.2 nM or 20 nM EGF for 2 min. Phospho-EGFR and total EGFR were detected with anti-pY1068 EGFR and EGFR, respectively. (F) Ratio of phosphorylated-Tyr1068 EGFR/total EGFR. The ratio was normalized to the mean value of lane #4 in (E). Data are means ± SD of three experiments. *p<0.05, **p<0.01, NS (not significant) on Welch’s t-test.

