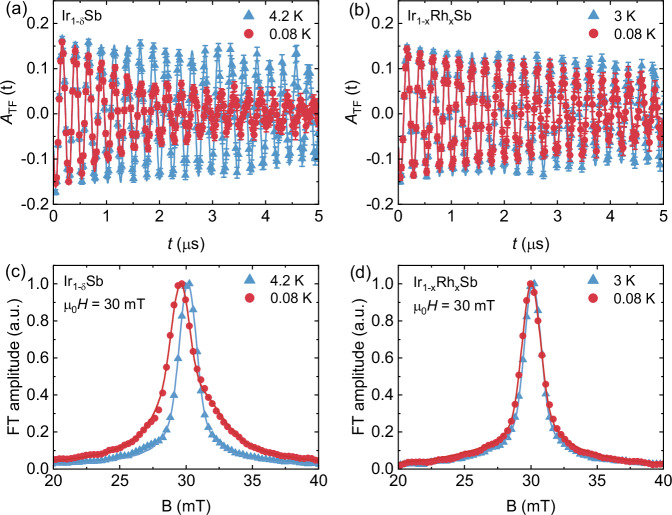
Fig. 2. Transverse-field (TF) μSR time spectra and the corresponding Fourier transforms.
μSR time spectra are obtained above and below Tc in the applied magnetic field of 30 mT (after field cooling the sample from above Tc) for Ir1−δSb, synthesized at 5.5 GPa, (a) and Ir1−xRhxSb with x = 0.3 (b). The corresponding Fourier transforms are shown in panel c for Ir1−δSb, synthesized at 5.5 GPa and in panel d for Ir1−xRhxSb with x = 0.3. Error bars are the s.e.m. in about 106 events. The error of each bin count n is given by the s.d. of n. The errors of each bin in A(t) are then calculated by s.e. propagation. The solid lines in a and b represent fits to the data by means of Eq. (2). The solid lines in c and d are the Fourier transforms of the fitted time spectra.

