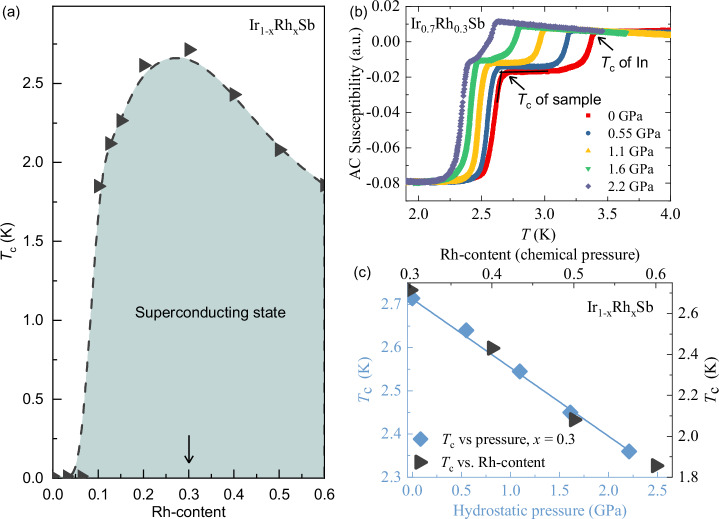
Fig. 6. Chemical and hydrostatic pressure effects on superconductivity in Ir1−xRhxSb.
a The superconducting critical temperature vs Rh-content, showing a dome-shaped SC phase diagram (adapted from ref. 13). The arrow indicates the sample with x = 0.3, which was measured under hydrostatic pressure. b The temperature dependence of AC susceptibility, measured at various hydrostatic pressures, ranging up to 2.21 GPa. c The superconducting critical temperature as a function of hydrostatic pressure and the Rh-content ("chemical pressure'') in the range between x = 0.3 and 0.6. The intention of this figure is to qualitatively illustrate the linear suppression of Tc both by hydrostatic pressure and Rh-content.

