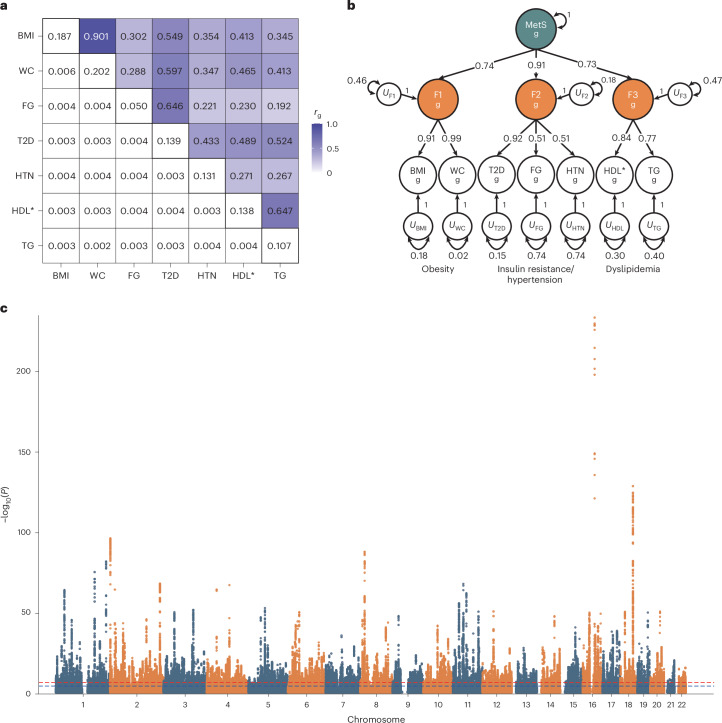
Fig. 1. Genetic correlations, multivariate genetic factor model and multivariate GWAS of MetS.
a, SNP-based heritability and pairwise genetic correlations for the seven MetS components were estimated using LD score regression. The off-diagonal upper, lower and diagonal triangles represent the pairwise genetic correlation, the standard error of the genetic correlation and SNP-based heritability, respectively. b, Path diagram with standardized factor loadings in the hierarchical model estimated using Genomic SEM. The U represents the residual variance that is not explained by the latent factor. The subscript g indicates that the model was built based on genetic covariances between the MetS components. c, Manhattan plot of Genomic SEM-based GWAS associations. The x axis represents the chromosomal position, and the y axis represents the uncorrected −log10(P) from two-sided z tests for SNP associations with MetS. *Reverse-coded.

