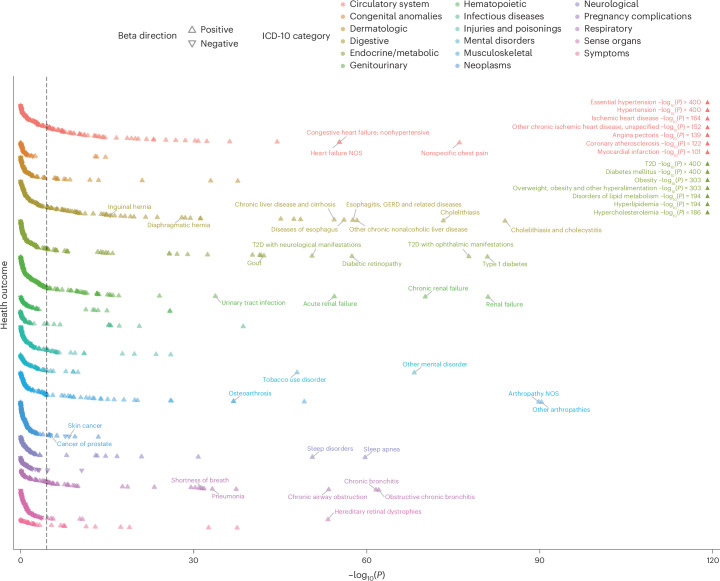
Fig. 5. Phenome-wide association study using the MetS PRS.
Scatterplot illustrating the association between the genome-wide MetS PRS and 1,621 health outcomes in the UKB. The x axis represents uncorrected −log10(P) from the two-sided z test for beta (that is, the log of the OR), and the y axis represents health outcomes. Health outcomes are color-coded by category; triangles indicate the direction of beta. Associations with high significance are labeled independently in the upper-right corner of the plot. The black dashed line represents the Bonferroni-corrected significance threshold of P < 3.08 × 10⁻⁵. NOS, nitric oxide synthase; GERD, gastroesophageal reflux disease.

