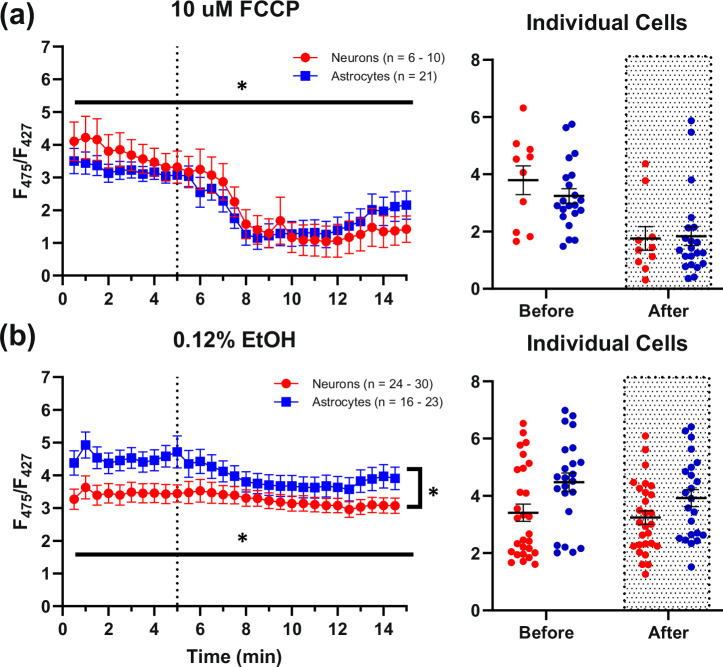
Fig. 2. PFR responses to 10 µM FCCP and 0.12% EtOH.
a shows large significant decreases in neuronal (n = 6–10) and astrocytic (n = 21) PFRs in response to a 10 µM FCCP exposure (dotted line). b shows the response to 0.12% EtOH (dotted line), which was used as the vehicle for FCCP (24–30 neurons; 16–23 astrocytes). It appears that EtOH contributes somewhat to the reduction of PFRs found in FCCP exposures, however the impact is relatively small. The spread of the data is displayed as averages of data collected at different time points before and after compound exposure for each respective set of imaging experiments (rightmost graphs). Asterisks represent a significant main effect of exposure or cell type. Error bars represent the standard error of the mean.

