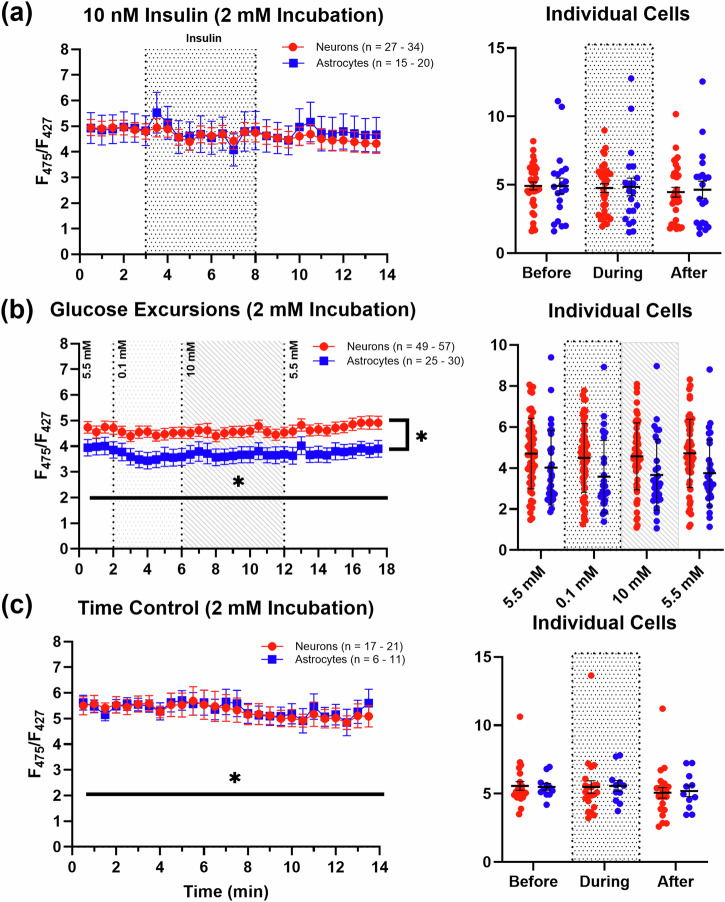
Fig. 4. Effects of low extracellular glucose pretreatment (30 min) on insulin exposures, glucose excursions, and time controls.
a displays no change in PFRs with a 5-min exposure to insulin during a 14-min imaging experiment (27–34 neurons; 15–20 astrocytes). b shows significant alterations in PFRs with glucose in both neurons (n = 49–57) and astrocytes (n = 25–30), which is dependent on cell type. Note that the largest change in PFRs was recorded in response to switching from 5.5 mM–0.1 mM. c shows the baseline activity of neurons (n = 17–21) and astrocytes (n = 6–11) during time control experiments. The spread of the data is displayed as averages of data collected at different time points before, during, and after compound exposure for each respective set of imaging experiments (rightmost graphs). Asterisks represent a significant main effect of exposure, time, or cell type. Error bars represent the standard error of the mean.

