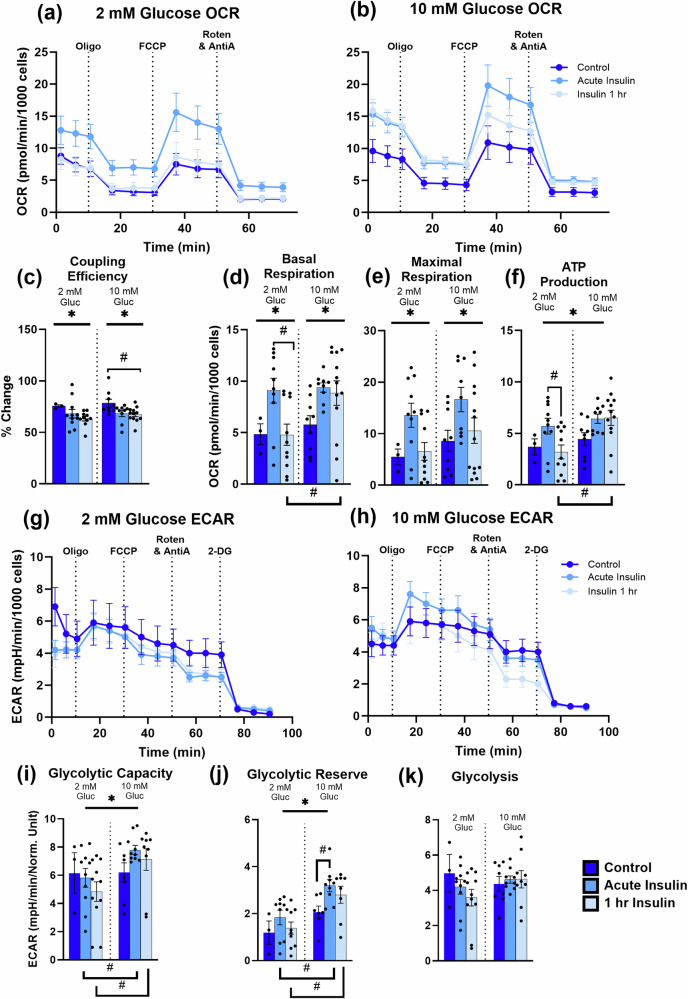
Fig. 5. SeahorseXFe96-based OCR and ECAR data.
a and b shows the oxygen consumption rate normalized to 1000 cells in mixed hippocampal cultures treated with several selective mitochondrial substrates/inhibitors in 2 mM and 10 mM extracellular glucose, respectively, as well as different durations of insulin exposure (control, acute insulin, and insulin 1 h). Variables extracted from this dataset include coupling efficiency (c), basal respiration (d), maximal respiration (e), and ATP production (f). g and h highlight the extracellular acidification rate normalized to 1000 cells in 2 mM and 10 mM glucose conditions, respectively, as well as insulin exposures. Variables extracted from these measurements include glycolytic capacity (i), glycolytic reserve (j), and glycolysis (k). Asterisks represent a significant main effect of exposure. Hashtags denote significance derived from post-hoc testing. Error bars represent the standard error of the mean.

