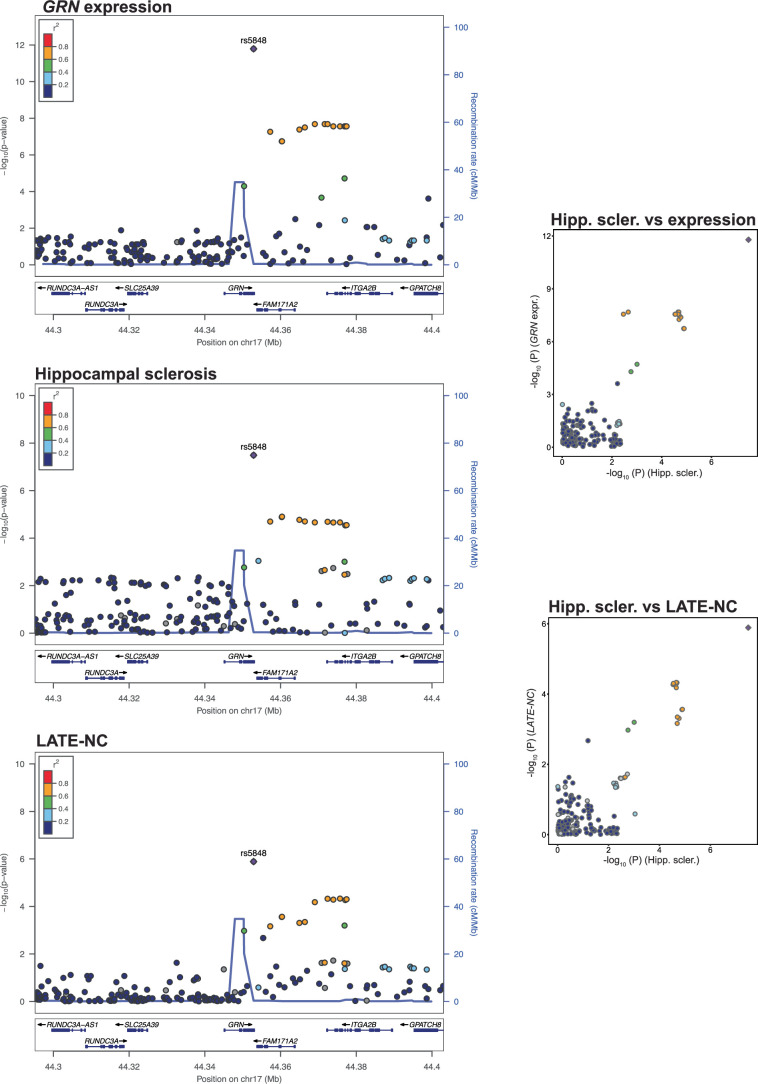
Extended Data Fig. 6. GRN expression, hippocampal sclerosis and LATE-NC all colocalize on GRN.
GRN gene expression, hippocampal sclerosis and LATE-NC association plot from NPE GWAS meta-analysis (n = 7,776) for the region around GRN. Colored dots represent the chromosomal position (x-axis, Mb, megabase) in hg38 coordinates and −log10(P from meta-analysis two-sided z test; y-axis) of each variant in the region. Dots are colored to represent the linkage disequilibrium r2 with the lead variant (purple dot) estimated with PLINK–r2 using 1000 Genomes Phase 3 European-descended participants. The recombination rate was calculated using GRCh38 genetic map files downloaded from https://bochet.gcc.biostat.washington.edu/beagle/genetic_maps/. Boxes below data indicate the location of genes in the region (plot generated using LocusZoom73).

