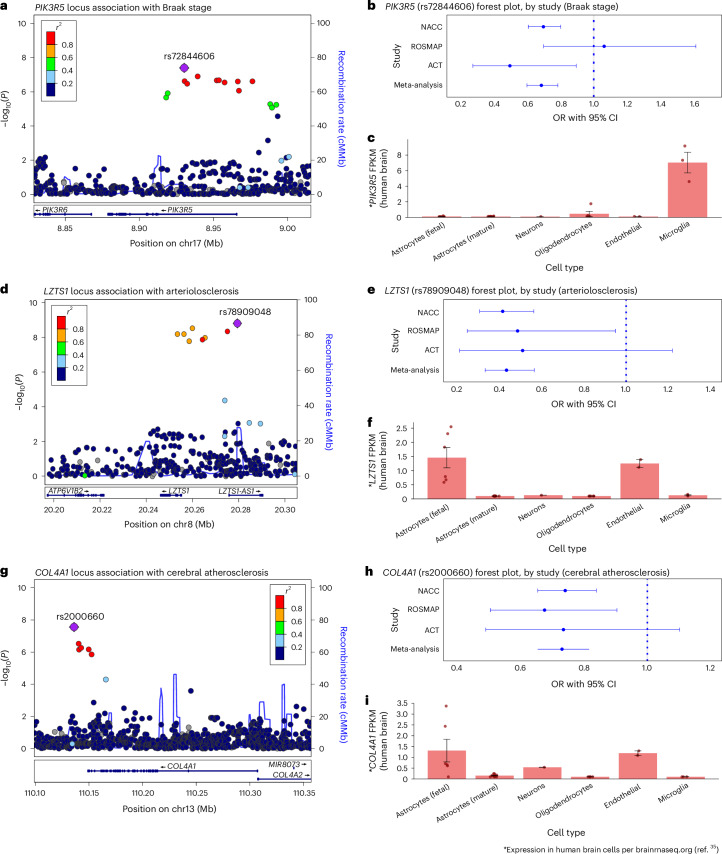
Fig. 3. New associations identified between PIK3R5, LZTS1 and COL4A1 and Braak NFT stage, arteriolosclerosis and cerebral atherosclerosis, respectively.
a, Braak stage association plot from NPE GWAS meta-analysis (n = 7,776) for the region around PIK3R5. Colored dots represent the chromosomal position (x axis, Mb) in hg38 coordinates and −log10(P value from meta-analysis two-sided z test; y axis) of each variant in the region. Dots are colored to represent the LD r2 with the lead variant (purple diamond) estimated with PLINK–r2 using 1000 Genomes phase 3 European-descended participants. The recombination rate was calculated using GRCh38 genetic map files downloaded from https://bochet.gcc.biostat.washington.edu/beagle/genetic_maps/ and taking the ratio of difference of CM and Mb between positions. Boxes below data indicate the location of genes in the region. (Plot generated using LocusZoom73.) b, Association of PIK3R5 lead variant (rs72844606) with Braak stage for individual cohorts (NACC, n = 5,927; ROSMAP, n = 1,172 and ACT, n = 677) and meta-analysis (n = 7,776) using METAL (y axis). Points along the x axis represent OR of association, and error bars indicate 95% CI. c, Human brain cell-type expression profile of PIK3R5 in ref. 35. Columns represent mean FPKM. Error bars indicate the s.e. of measurement for each cell type based on the number of human samples sequenced for each type (fetal astrocytes, n = 6; mature astrocytes, n = 12; endothelial, n = 2; microglia, n = 3; neurons, n = 1 and oligodendrocytes, n = 5). PIK3R5 is primarily expressed in microglia. d, Arteriolosclerosis association plot from NPE GWAS meta-analysis (n = 6,668) for the region around LZTS1 (see a for interpretation). e, Association of LZTS1 lead variant (rs78909048) with arteriolosclerosis for individual cohorts (NACC, n = 4,930; ROSMAP, n = 1,163 and ACT, n = 575) and meta-analysis (n = 6,668) using METAL (y axis; see b for interpretation). f, Human brain cell-type expression profile of LZTS1 in ref. 35. LZTS1 is primarily expressed in fetal astrocytes and endothelial cells (see c for interpretation). g, Cerebral atherosclerosis association plot from NPE GWAS meta-analysis (n = 7,340) for the region around COL4A1 (see a for interpretation). h, Association of COL4A1 lead variant (rs2000660) with cerebral atherosclerosis for individual cohorts (NACC, n = 5,496; ROSMAP, n = 1,175 and ACT, n = 669) and meta-analysis (n = 7,340) using METAL (y axis; see b for interpretation). i, Human brain cell-type expression profile of COL4A1 in ref. 35. COL4A1 is preferentially expressed in fetal astrocytes and endothelial cells with lower expression in neurons (see c for interpretation). Mb, megabase.

