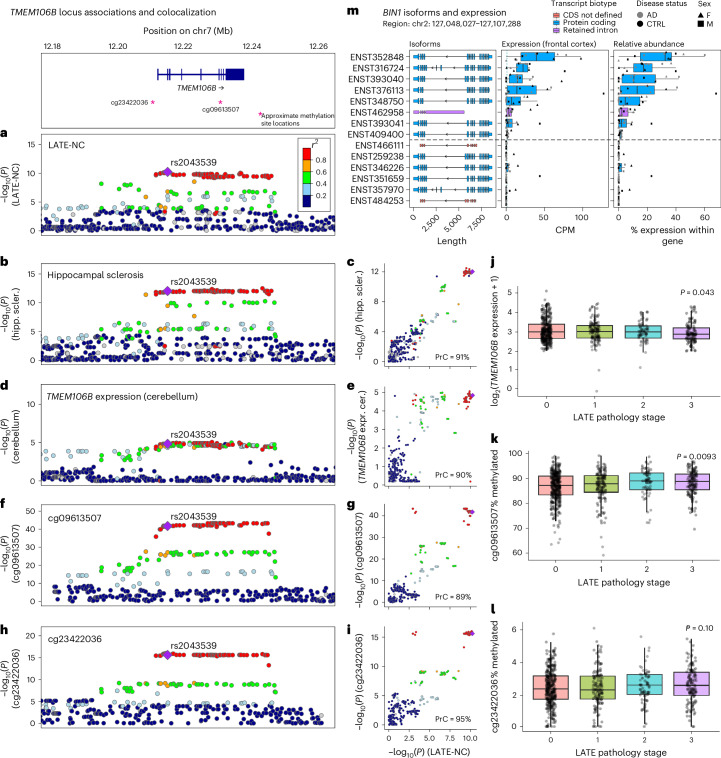
Fig. 4. Hippocampal sclerosis and quantitative trait locis all colocalize with LATE-NC on TMEM106B.
We investigated whether loci associated with multiple NPEs show evidence for genetic colocalization using a Bayesian colocalization analysis approach implemented in the coloc R package72. a, The TMEM106B lead variant (rs2043539) reached genome-wide significance with LATE-NC. b,c, Hippocampal sclerosis colocalized with LATE-NC on TMEM106B (PrC = 91%). d,e, TMEM106B expression colocalized with LATE-NC (PrC = 90%). f–i, Two methylation QTL (mQTLs), cg09613507 (PrC = 89%; f,g) and cg23422036 (PrC = 95%; h,i), also colocalized with LATE-NC. a, b, d, f and h show regional LocusZoom73 plots for each trait. Purple diamonds represent lead variants. c, e, g and i compare −log10(P) values between each trait compared to LATE-NC −log10(P) values across the TMEM106B rs2043539 locus (color legend same as in a). The TMEM106B expression and the methylation data were obtained from ROSMAP. j, Decreased TMEM106B expression was associated with more severe LATE-NC pathology (P = 0.043). Unless otherwise specified, for all boxplots, boxes outline the first quartile, median and third quartile. Whiskers extend up to 1.5× the distance between the first and third quartiles. k, Hypermethylation of cg09613507 was associated with more severe LATE-NC pathology (P = 0.0093). l, Methylation at cg23422036 was not significantly associated (P = 0.10). m, Unrelated to TMEM106B, BIN1 expresses eight distinct RNA isoforms simultaneously in the frontal cortex from six AD cases and six controls. To understand the complexities and nuances of ADRDs, we also need to understand the nuances of the genes purported to be driving disease. CDS, coding sequence; CTRL, control; CPM, counts per million; F, female; M, male; hipp. scler., hippocampal sclerosis; expr. cer., expression in cerebellum.

