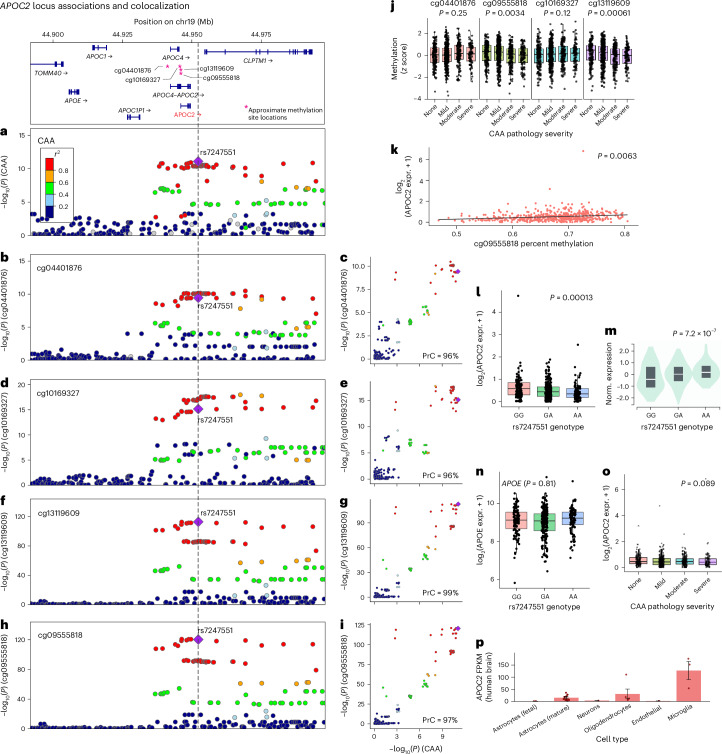
Fig. 5. Four mQTL colocalize with CAA on APOC2.
Using the same Bayesian colocalization analysis approach from Fig. 4 (coloc 5.2.2 R package72), we tested for colocalization between CAA and methylation sites using existing data from ROSMAP. a, Lead SNP rs7247551, near APOC2, reached genome-wide significance with CAA. b,d,f,h, The rs7247551 was also significantly associated with four mQTL. b–i, cg04401876 (PrC = 96%; b,c), cg10169327 (PrC = 96%; d,e), cg13119609 (PrC = 99%; f,g) and cg09555818 (PrC = 97%; h,i) all colocalized with CAA. a, b, d, f and h show regional LocusZoom73 plots for each trait. c, e, g and i compare −log10(P) values between each trait compared to CAA −log10(P) values across the APOC2 rs7247551 locus. Variants in LD with the lead variant (purple diamond in a–i) are shaded in a–i according to the color legend on the left-hand side of a. j, Plots of normalized methylation level versus CAA pathology severity. Hypomethylation at cg09555818 (OR = 0.82, P = 0.003) and cg13119609 (OR = 0.78, P = 0.0006) were significantly associated with more severe CAA pathology. Unless otherwise specified, for all boxplots, boxes outline the first quartile, median and third quartile. Whiskers extend up to 1.5× the distance between the first and third quartiles. k, Both cg09555818 (P = 0.0063; k) and cg13119609 (P = 0.0069; not shown) were significantly associated with APOC2 expression. l,m, The rs7247551 G allele was significantly associated with increased APOC2 expression in the frontal cortex in ROSMAP (β = 0.072, P = 0.00013; l); however, the direction of effect was opposite of that found in brain tissues in GTEx (P = 7.2 × 10⁻⁷; m). n,o, The rs7247551 was not associated with APOE (P = 0.81; n) or APOC2 (P = 0.89; o) expression in frontal cortex in ROSMAP. p, APOC2 is highly expressed, especially in microglia and oligodendrocytes. Columns represent mean FPKM. Error bars indicate the s.e. of measurement for each cell type based on the number of human samples sequenced for each type (fetal astrocytes, n = 6; mature astrocytes, n = 12; neurons, n = 1; oligodendrocytes, n = 5; endothelial, n = 2 and microglia, n = 3). expr., expression; norm., normalized.

