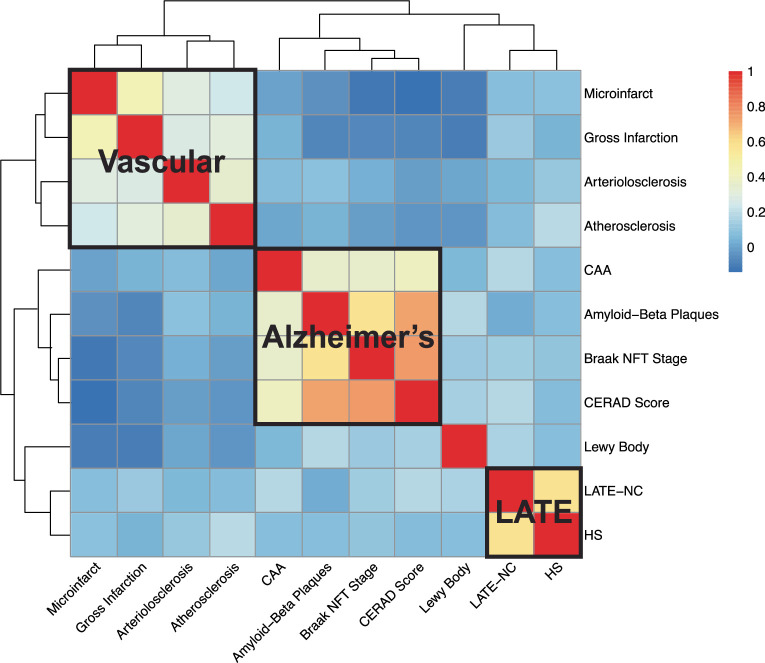
Extended Data Fig. 1. Heatmap of the polychoric correlations of 11 neuropathology endophenotypes.
The y-axis (rows) and x-axis (columns) refer to the neuropathology endophenotype pairs with the hierarchical clustering generated by the polychoric correlations calculation. The red and blue color refers to high and low correlations between the neuropathology endophenotype pairs. The three positively correlated clusters of endophenotypes that match general expectations are highlighted by the black solid lines: a ‘vascular’ cluster consisting of gross infarcts, microinfarcts, arteriolosclerosis and atherosclerosis; an ‘Alzheimer’s disease’ cluster consisting of Braak NFT stage, neuritic plaques, amyloid-beta plaques and CAA; and a ‘LATE’ cluster consisting of LATE-NC and HS, respectively.

