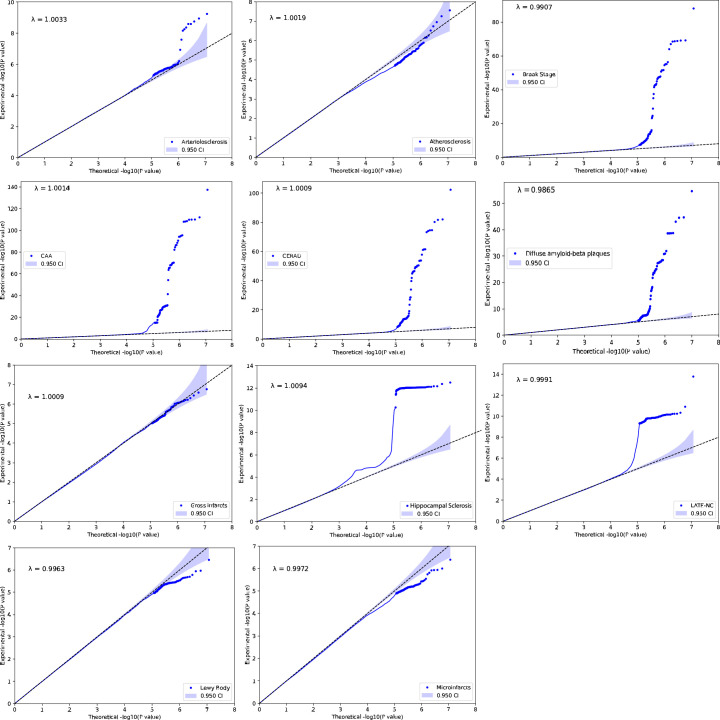
Extended Data Fig. 2. Quantile–quantile (QQ) plots for the 11 neuropathology endophenotype.
The y-axis refers to the experimental −log10(P) from two-sided z test of the genome-wide association study (GWAS) meta-analysis. The x-axis refers to the theoretical −log10(P) based on percentile. Each point represents a single-nucleotide polymorphism (SNP). The line of identity (y = x) is shown in a black dashed line, indicating the expected alignment under the null hypothesis. Deviations from this line suggest possible inflation due to population structure or polygenic effects. The genomic inflation factor lambda (λ) is calculated for each phenotype indicating minimal inflation of test statistics. The λ estimates ranged from 0.9907 to 1.0094, and visual inspection of the QQ plots did not suggest any systematic bias in the data.

