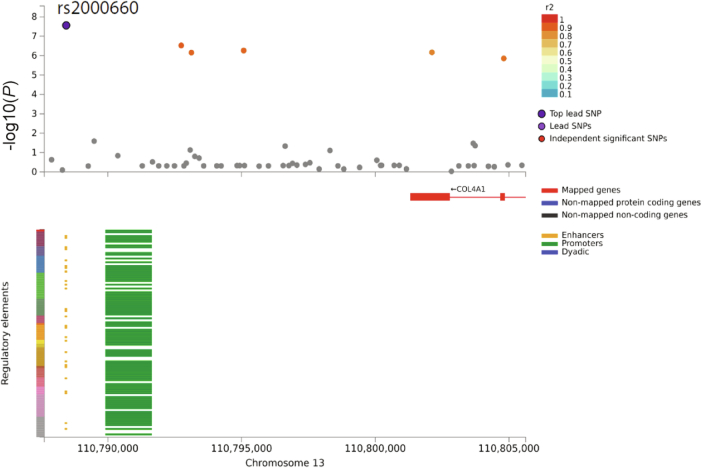
Extended Data Fig. 4. Regional plot and the chromatin interaction plot of rs2000660 that is associated with cerebral atherosclerosis.
Atherosclerosis association plot from NPE GWAS meta-analysis (n = 7,340) for the SNP of rs2000660. The x-axis refers to the position of the genome. In the top plot, the y-axis refers to the −log10(P) from meta-analysis two-sided Z test. The lead variant, rs2000660, is circled in black and colored in dark purple. Variants meeting the threshold of P < 1 × 10⁻⁵ were colored coded according to linkage disequilibrium r2 to rs200060. Other variants are colored in gray. The figures are generated by FUMA pipelines (https://fuma.ctglab.nl). In the bottom plot, the x-axis refers to the genome position, and the y-axis refers to the type of regulatory elements in the chromatin interaction plot for rs2000660.

