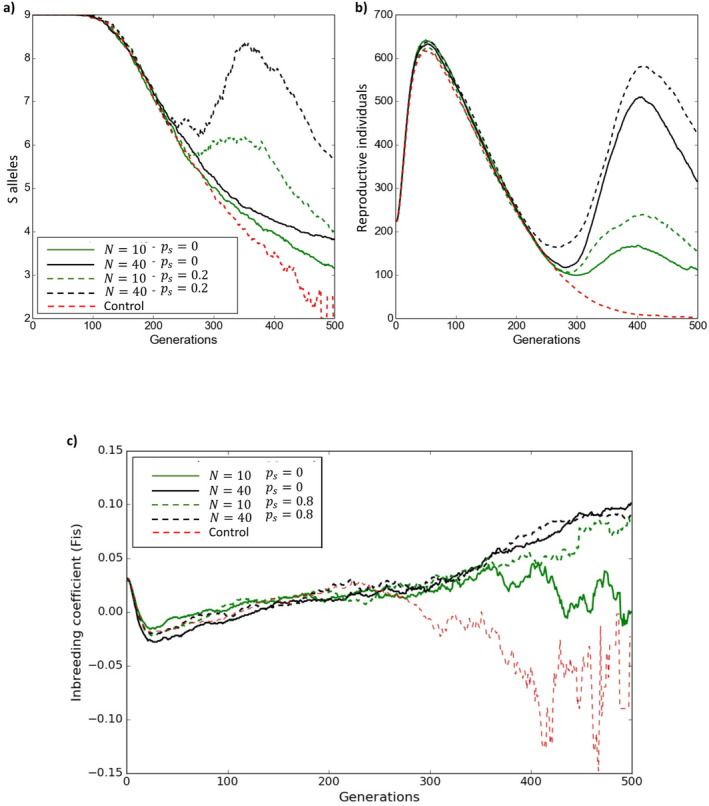
FIGURE 2.

Temporal dynamics of S allele numbers (a), reproductive individuals (b) and inbreeding coefficient (F IS) (c). Each line represents the temporal trajectory of different variables for different scenarios of genetic (dashed lines, p s = 0.8) and demographic (solid lines, p s = 0) rescue. The control (i.e., no intervention) scenario is represented in dashed red lines.
