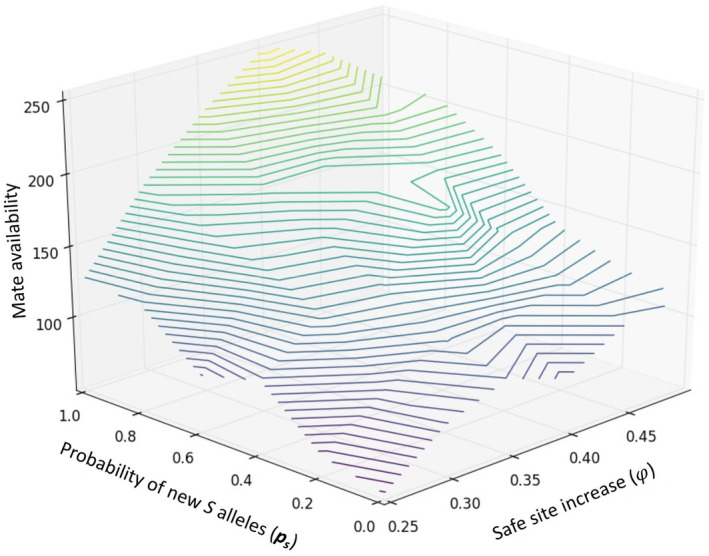
FIGURE 4.

Effects of the combination of genetic and habitat rescue on mate availability. Safe site increases represent fractions of suitable sites () for habitat rescue and probability of new S alleles represents the probability of introducing new genetic variation () by genetic rescue. The 3D surface represents average mate availability values for combinations of and Colors represent average mate availability values going from low (dark purple) to high (yellow).
